

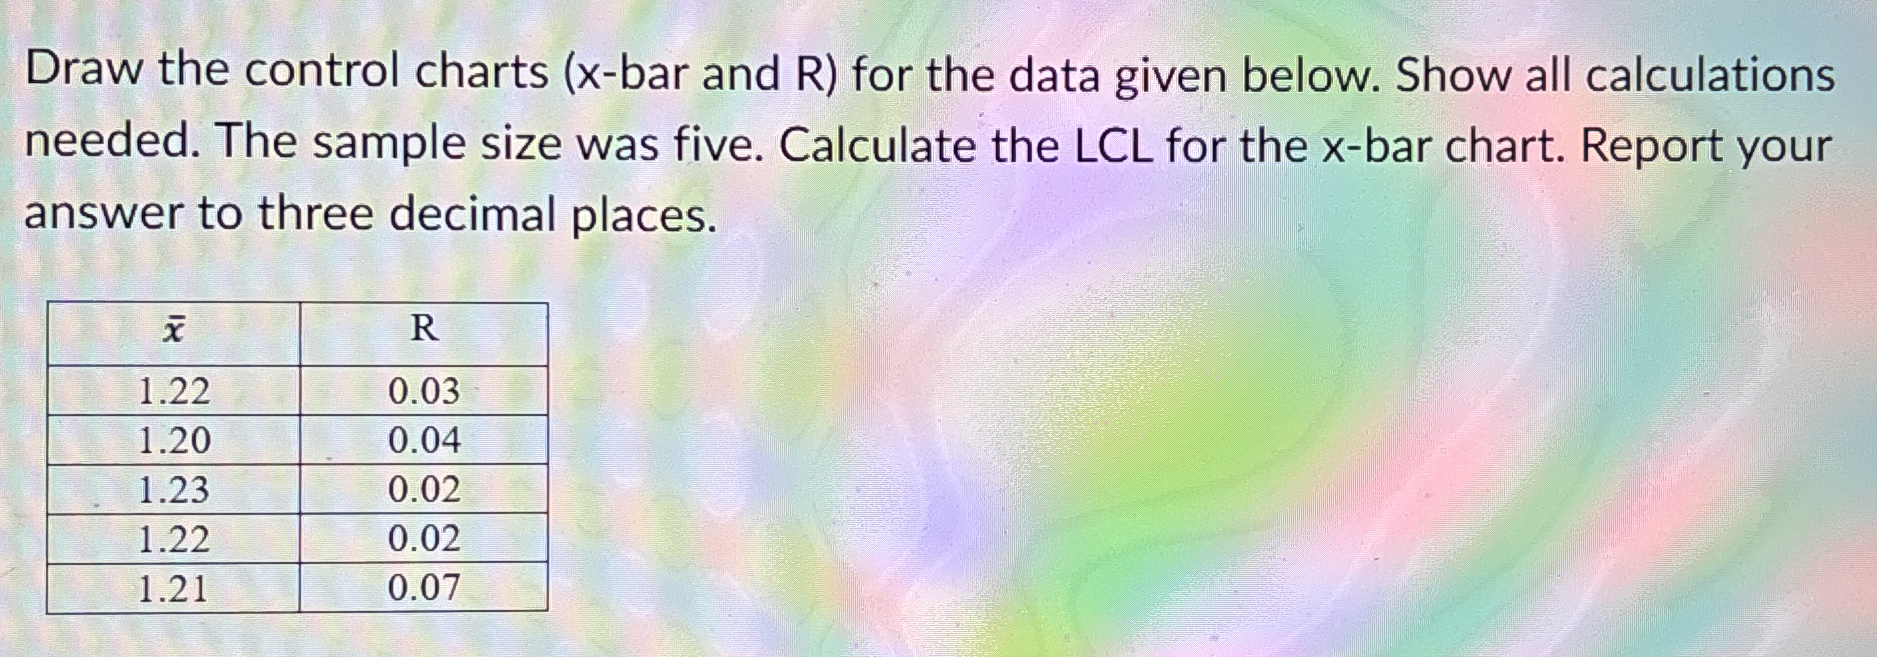
Question: Draw the control charts ( x - bar and R ) for the data given below. Show all calculations needed. The sample size was five.
Draw the control charts xbar and R for the data given below. Show all calculations
needed. The sample size was five. Calculate the LCL for the bar chart. Report your
answer to three decimal places.
Step by Step Solution
There are 3 Steps involved in it
1 Expert Approved Answer
Step: 1 Unlock

Question Has Been Solved by an Expert!
Get step-by-step solutions from verified subject matter experts
Step: 2 Unlock
Step: 3 Unlock