

Question: During a training session with gradient descent algorithm, the following graph for loss function is observed. What could be the reason for this behavior?
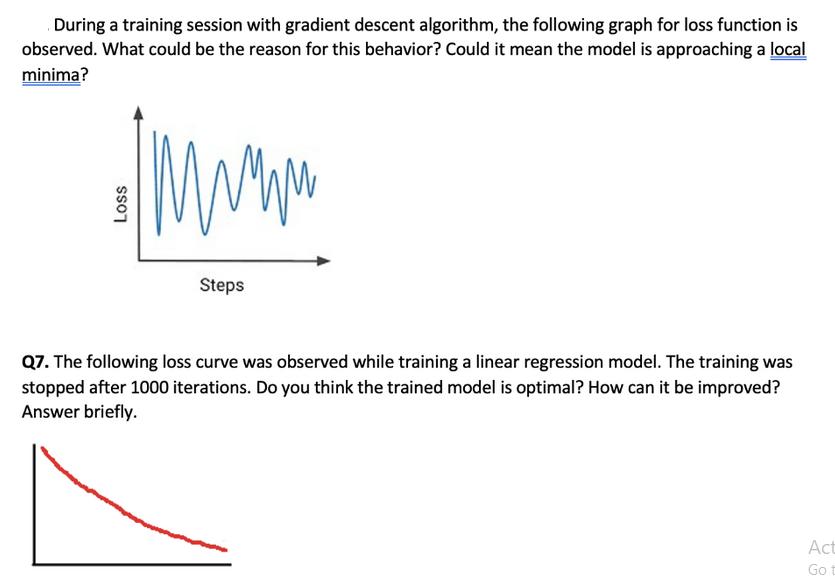
During a training session with gradient descent algorithm, the following graph for loss function is observed. What could be the reason for this behavior? Could it mean the model is approaching a local minima? Loss www. Steps Q7. The following loss curve was observed while training a linear regression model. The training was stopped after 1000 iterations. Do you think the trained model is optimal? How can it be improved? Answer briefly. Act Go t
Step by Step Solution
There are 3 Steps involved in it
1 Expert Approved Answer
Step: 1 Unlock

Question Has Been Solved by an Expert!
Get step-by-step solutions from verified subject matter experts
Step: 2 Unlock
Step: 3 Unlock