

Question: Q6. During a training session with gradient descent algorithm, the following graph for loss function is observed. What could be the reason for this behavior?
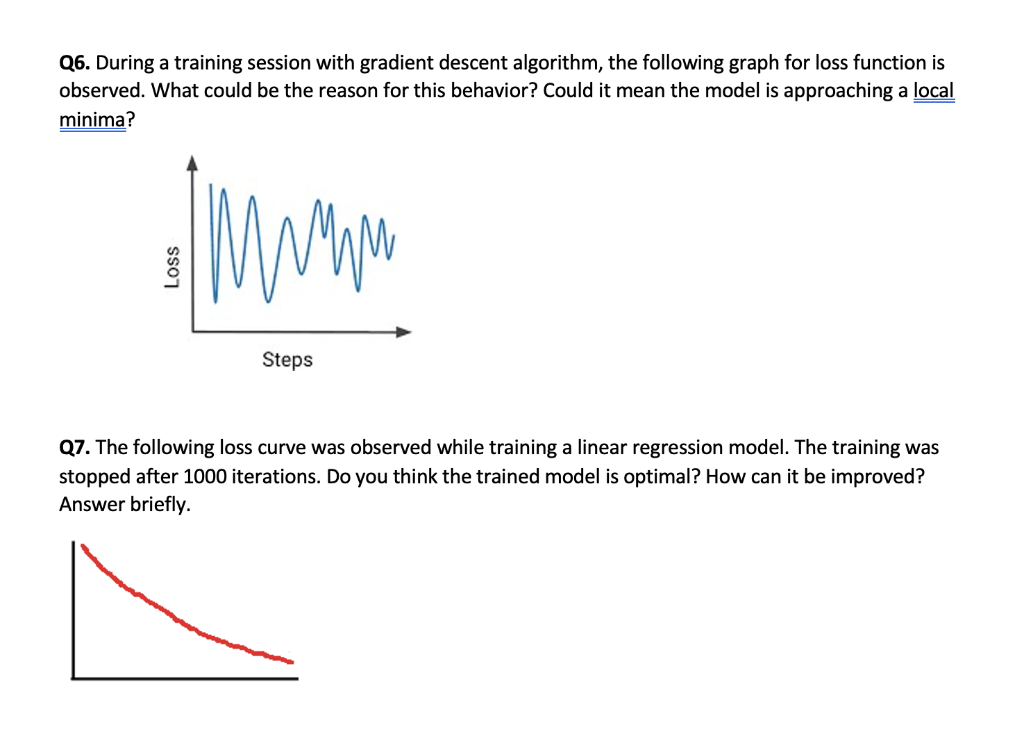
Q6. During a training session with gradient descent algorithm, the following graph for loss function is observed. What could be the reason for this behavior? Could it mean the model is approaching a local minima? Q7. The following loss curve was observed while training a linear regression model. The training was stopped after 1000 iterations. Do you think the trained model is optimal? How can it be improved? Answer briefly
Step by Step Solution
There are 3 Steps involved in it
1 Expert Approved Answer
Step: 1 Unlock

Question Has Been Solved by an Expert!
Get step-by-step solutions from verified subject matter experts
Step: 2 Unlock
Step: 3 Unlock