

Question: Estimating the elasticity matrix. In this problem you create a standard model of how demand varies with the prices of a set of products,
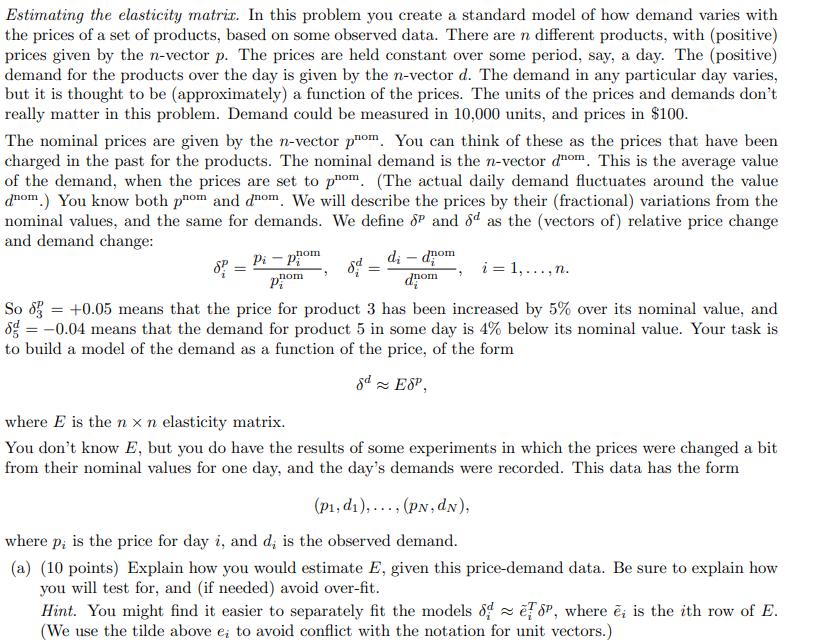
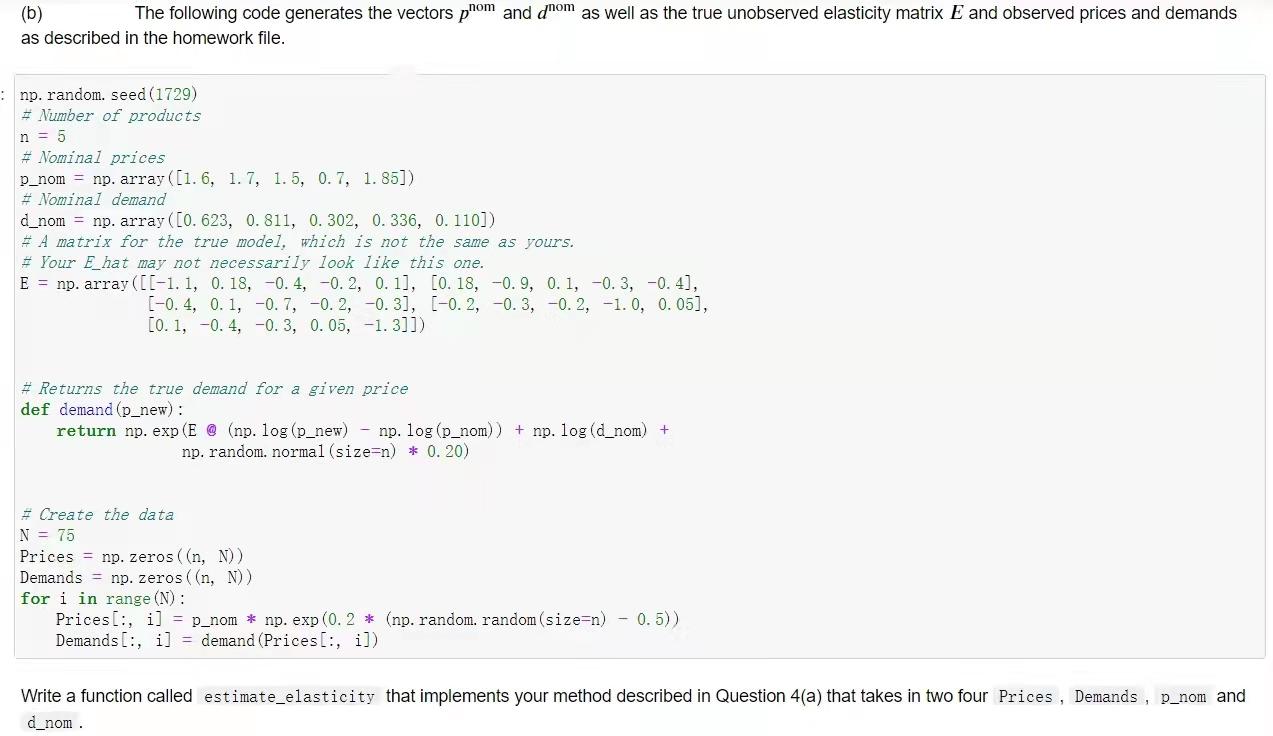
Estimating the elasticity matrix. In this problem you create a standard model of how demand varies with the prices of a set of products, based on some observed data. There are n different products, with (positive) prices given by the n-vector p. The prices are held constant over some period, say, a day. The (positive) demand for the products over the day is given by the n-vector d. The demand in any particular day varies, but it is thought to be (approximately) a function of the prices. The units of the prices and demands don't really matter in this problem. Demand could be measured in 10,000 units, and prices in $100. The nominal prices are given by the n-vector pnom. You can think of these as the prices that have been charged in the past for the products. The nominal demand is the n-vector dnom. This is the average value of the demand, when the prices are set to phom. (The actual daily demand fluctuates around the value dnom.) You know both pnom and dom. We will describe the prices by their (fractional) variations from the nominal values, and the same for demands. We define 8P and 8d as the (vectors of) relative price change and demand change: nom Pi-Pi nom 8d = di - dom nom i= 1,..., n. So 8 +0.05 means that the price for product 3 has been increased by 5% over its nominal value, and 8 = -0.04 means that the demand for product 5 in some day is 4% below its nominal value. Your task is to build a model of the demand as a function of the price, of the form 8d ESP, where E is the n x n elasticity matrix. You don't know E, but you do have the results of some experiments in which the prices were changed a bit from their nominal values for one day, and the day's demands were recorded. This data has the form (p, di),..., (PN, dN), where p, is the price for day i, and d, is the observed demand. (a) (10 points) Explain how you would estimate E, given this price-demand data. Be sure to explain how you will test for, and (if needed) avoid over-fit. Hint. You might find it easier to separately fit the models de SP, where ei is the ith row of E. (We use the tilde above e; to avoid conflict with the notation for unit vectors.) (b) The following code generates the vectors pnom and dnom as well as the true unobserved elasticity matrix E and observed prices and demands as described in the homework file. np. random. seed (1729) # Number of products n = 5 # Nominal prices p_nom np. array ([1.6, 1.7, 1.5, 0.7, 1.85]) # Nominal demand d_nom = np. array ([0. 623, 0.811, 0. 302, 0.336, 0.110]) # A matrix for the true model, which is not the same as yours. # Your E hat may not necessarily look like this one. E = np. array ([[-1.1, 0. 18, -0.4, -0.2, 0. 11, [0. 18, -0.9, 0.1, -0.3, -0. 4], [-0.4, 0.1, -0. 7, -0.2, -0.3], [-0.2, 0.3, -0.2, -1.0, 0. 05], [0. 1, -0. 4, -0.3, 0. 05, -1.3]]) #Returns the true demand for a given price def demand (p_new) : return np. exp (E @ (np. log (p_new) - np. log (p_nom)) + np. log (d_nom) + np. random. normal (size=n) * 0. 20) # Create the data N = 75 Prices = np. zeros((n, N)) Demands = np. zeros((n, N)) for i in range (N) : Prices, i] Demands [, i] = demand (Prices[:, i]) p_nom * np. exp (0. 2* (np. random. random (size=n) - 0.5)) Write a function called estimate_elasticity that implements your method described in Question 4(a) that takes in two four Prices, Demands, p_nom and d_nom.
Step by Step Solution
3.63 Rating (157 Votes )
There are 3 Steps involved in it
Answer Aquafreshs own price elasticity is 15 The negative value indicates that price increases will ... View full answer

Get step-by-step solutions from verified subject matter experts