

Question: expected return = 16.8% standard deviation = 24% Portfolio Theory Problem You are given the following information. Answer the following question using this information, UNLESS
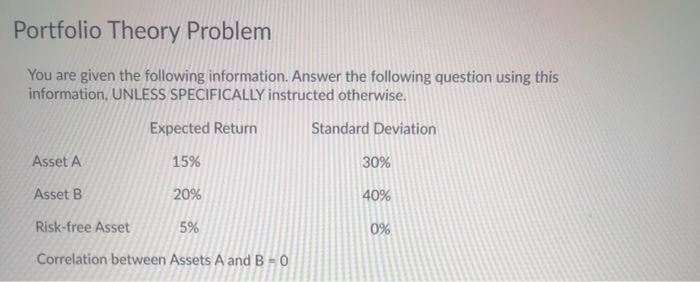
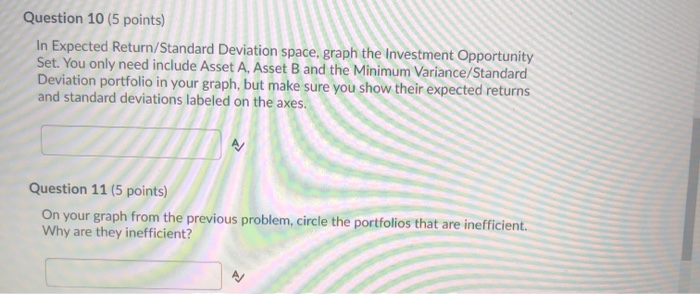
Portfolio Theory Problem You are given the following information. Answer the following question using this information, UNLESS SPECIFICALLY instructed otherwise. Expected Return Standard Deviation Asset A 15% 30% Asset B 20% 40% Risk-free Asset 5% 0% Correlation between Assets A and B -0 Question 10 (5 points) In Expected Return/Standard Deviation space, graph the Investment Opportunity Set. You only need include Asset A, Asset B and the Minimum Variance/Standard Deviation portfolio in your graph, but make sure you show their expected returns and standard deviations labeled on the axes. Question 11 (5 points) On your graph from the previous problem, circle the portfolios that are inefficient Why are they inefficient? Portfolio Theory Problem You are given the following information. Answer the following question using this information, UNLESS SPECIFICALLY instructed otherwise. Expected Return Standard Deviation Asset A 15% 30% Asset B 20% 40% Risk-free Asset 5% 0% Correlation between Assets A and B -0 Question 10 (5 points) In Expected Return/Standard Deviation space, graph the Investment Opportunity Set. You only need include Asset A, Asset B and the Minimum Variance/Standard Deviation portfolio in your graph, but make sure you show their expected returns and standard deviations labeled on the axes. Question 11 (5 points) On your graph from the previous problem, circle the portfolios that are inefficient Why are they inefficient
Step by Step Solution
There are 3 Steps involved in it

Get step-by-step solutions from verified subject matter experts