

Question: fill in yellow boxes with excel formula for 1 & 2 Create a histogram for MBA. 1. To create a histogram the data must be
fill in yellow boxes with excel formula for 1 & 2 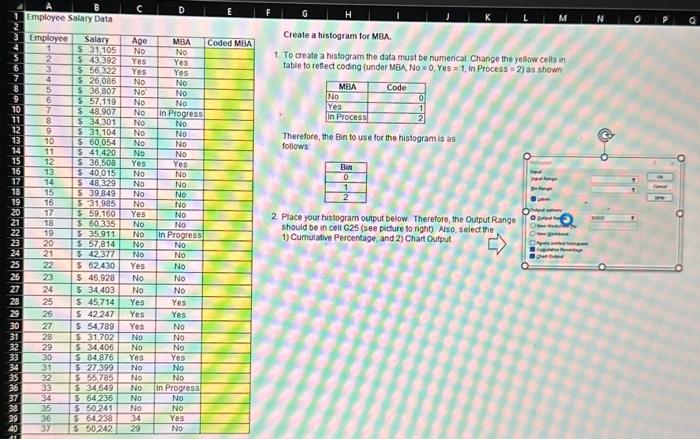
Create a histogram for MBA. 1. To create a histogram the data must be numerical Change the yellow cells in table to reffect coding (under MBA, No =0,Yes=1. in Process =2 ) as showns Therefore, the Bin to use for the histogram is as follows 2. Place your histogram output below. Therefore, the Output Range should be in cell G25 (see picture to right) Also, select the. 1) Cumulative Percentage, and 2) Chart Output
Step by Step Solution
There are 3 Steps involved in it
1 Expert Approved Answer
Step: 1 Unlock

Question Has Been Solved by an Expert!
Get step-by-step solutions from verified subject matter experts
Step: 2 Unlock
Step: 3 Unlock