Question: From the Data tab select what if analysis and create a scenario: Decrease overhead for airport 2019 Q1 and Q3 by 10%. How this will
| From the Data tab select what if analysis and create a scenario: Decrease overhead for airport 2019 Q1 and Q3 by 10%. How this will effect profit? Display the scenario building result worksheet |
| Using the Data tab select what if goal seek and set as goal 2017,Q2, Downtown, premium profit to reach 300000 from 118448. What revenue must be generated to create this profit? Shoe your scenario goal seeking screenshot\ Please help me how to this steps in excel!!! |
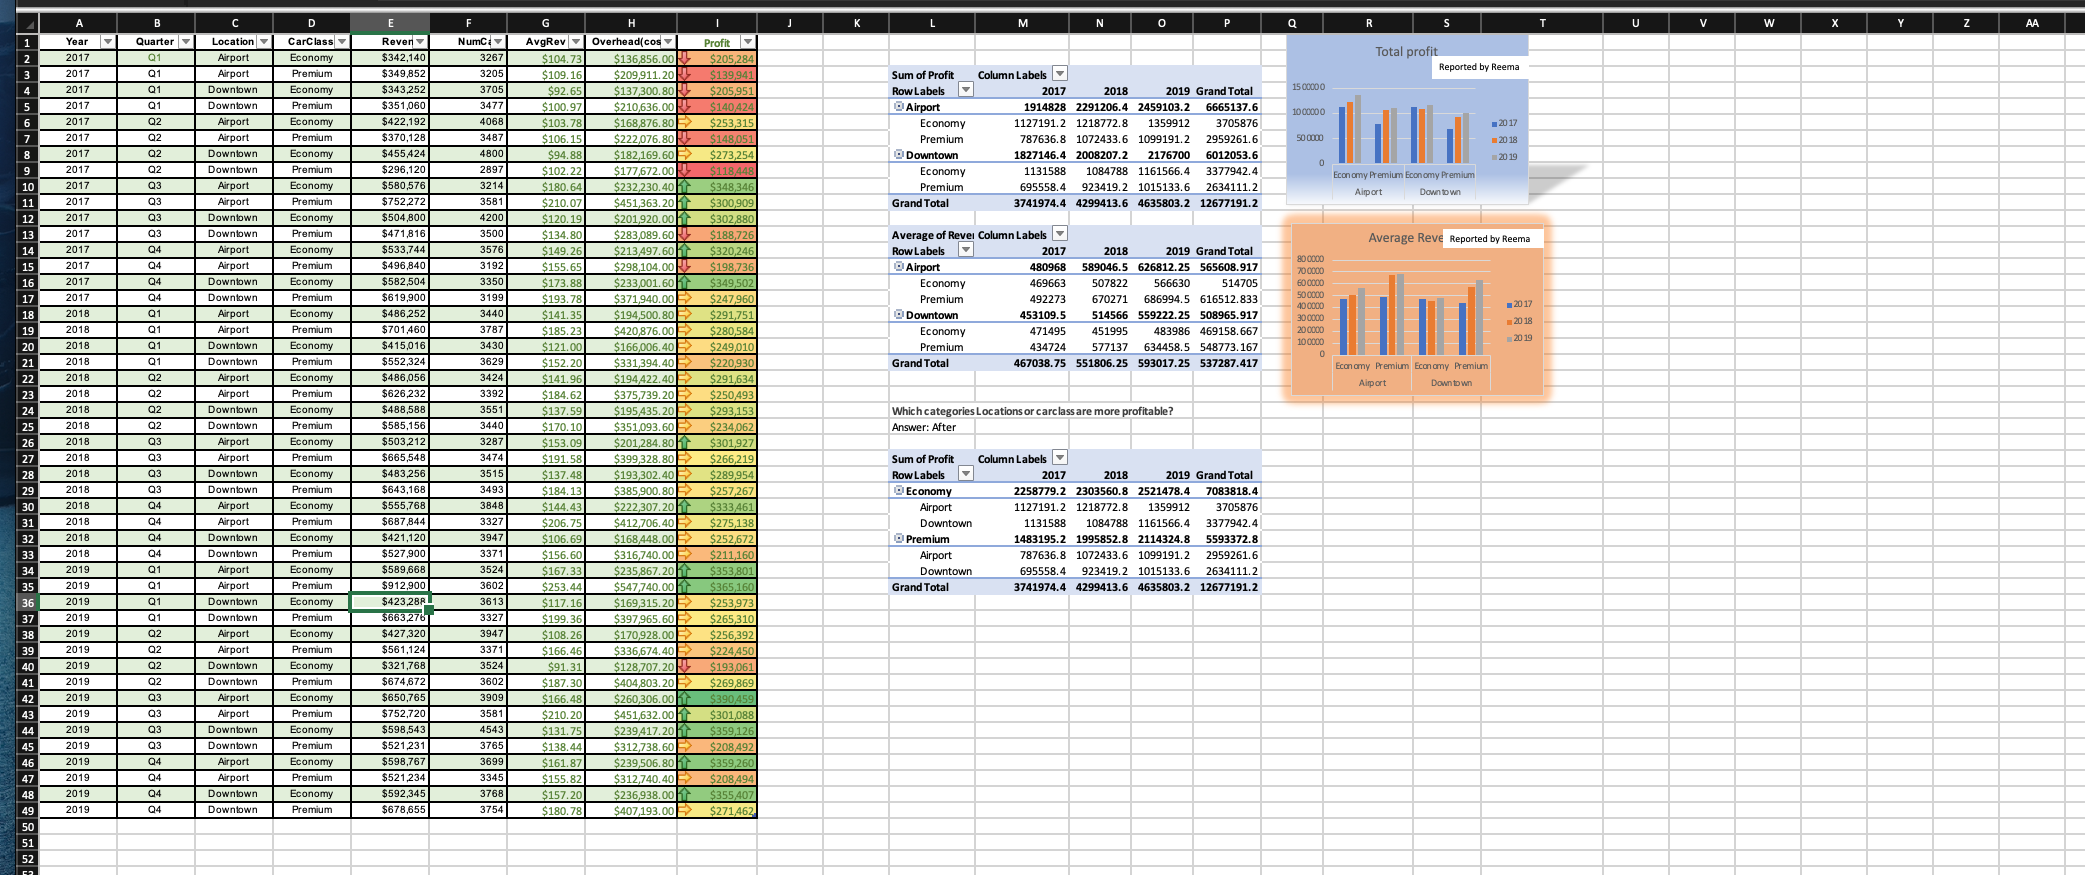
F H T L M N o P Q R S T V W Y Z AA 1 2 B Quarter - Q1 Q1 09 Q1 Q1 Q2 C Location Airport Airport Downtown Total profit Reported Reema 1500000 4 Downtown 1000000 6 Q2 Sum of Profit Row Labels Airport Economy Premium O Downtown Economy Premium Grand Total Column Labels 2017 2018 2019 Grand Total 1914828 2291206.4 2459103.2 6665137.6 1127191.2 1218772.8 1359912 3705876 787636.8 1072433.6 1099191.2 2959261.6 1827146.4 2008207.2 2176700 6012053.6 1131588 1084788 1161566.4 3377942.4 695558.4 923419.2 1015133.6 2634111.2 3741974.4 4299413.6 4635803.2 12677191.2 500000 2017 2018 2019 Q2 0 Q2 Economy Premium Economy Premium Downtown 03 03 Airport SEOA 03 03 A Year 2017 2017 2017 2017 2047 2017 2047 2017 2017 2017 2047 2017 2017 2017 2047 2017 2017 2017 2047 2017 2047 2017 2047 2017 2047 2017 2045 2017 2017 2017 2040 2018 2040 2018 2018 2040 2018 2040 2018 2040 2018 2040 2018 2040 2018 2046 2018 2018 2018 D CarClass Economy Premium From Economy Premium Premium Economy Premium Economy Premium ___ Economy Premium Economy Premium ___ Economy Premium Economy Premium ___ Economy Premium Economy Premium Economy Premium Economy Premium Economy 9 10 10 11 12 13 14 15 16 - 17 10 18 19 20 20 21 Average Reve Reported by Reema 04 AvgRev $104.73 $109.16 $92.65 $100.97 $103.78 $106.15 $94.88 ... $102.22 $180.64 $210.07 $120.19 $134.80 $149.26 $155.65 $173.88 $193.78 $141.35 $185.23 $121.00 $152.20 4 $141.96 $184.62 $137.59 $170.10 $153.09 404 Overhead(cos $136,856.00 $209,911.20 $137,300.80 $210,636.00 C4 $168,876.8 $222,076.80 $182,169.60 $177,672.00 $232,230.40 $451,363 - $ 201,920.00 h $283,089.60 $213497 IN $298,104.00 $233,001 $371,940.00 $194,500. $420,876.00 $166,006.40 $331,394.40 $194,422.40 ---- $375,739 $195435.20 COEL $351,093.60 $201,284.86 04 04 04 $619.900 Average of Revel Column Labels 2017 2017 Row Labels 2018 2019 Grand Total Airport 480968 589046.5 626812.25 565608.917 Economy 469663 507822 566630 514705 Premium 492273 670271 686994.5 616512.833 O Downtown 453109.5 514566 559222.25 508965.917 Economy 471495 451995 483986 469158.667 Premium 434724 577137 634458.5 548773.167 Grand Total 467038.75 551806.25 593017.25 537287.417 800000 700000 600000 500000 400000 300000 200000 100000 2017 E Reven $342,140 $349,852 $ $351,060 251 080 2010 $422,192 $370,128 $455,424 $296,120 CERNE $580,576 ZE 27 $752.272 $504,800 4294 046 $471,816 24 $533,744 20 $496,840 SP $582,504 Sezon CADE 29 $486 252 2014 $701460 $415,016 $552,324 Ape EE $486,056 SE2 222 $626,232 $488,588 CERE $585,156 $503212 $665,548 $483256 $643,168 . $555,768 $687 844 $421,120 ee $527,900 $589,668 $912.900 $423,287 $663,276 $427,320 $561,124 ene $321,768 ene $674,672 $650,765 2018 2019 Q1 Q1 Q1 Q2 Economy Premium Economy Premium Airport Downtown 25 Q2 O SRB Q2 Numc 3267 3205 2705 3705 2427 3477 4000 4068 3487 2000 4800 2897 24 3214 rea 3581 4000 4200 3500 Ez 3576 400 3192 3350 400 3199 2440 3440 3787 3430 3629 2498 3424 900 3392 ACES 3551 2440 3440 2007 3287 3474 3515 3493 3848 3327 3947 00 3371 som 3524 3602 3613 3327 - 3947 3371 3524 3602 w 3909 3581 - 4543 3765 3699 3345 3768 3754 Which categories Locations or carclass are more profitable? Answer: After 25 26 27 28 Profit $205,284 $139,941 $205,951 $140,424 $253,315 $148,051 $273,254 $1184 2020 $348,346 $300,909 $302,880 $188,726 $320,246 $198,736 $349,502 $247,960 $291,751 $280,584 $249,010 $220,930 $291,634 $250,493 $293,153 $234,062 $301,927 $266,219 $289.954 1223 $257.267 $333 461 2213150 $275,138 $252,672 2012 $211,160 $353 801 $365 16 $253.973 2203310 $265,310 $256 394 $224,450 $193,061 --- $269 869 $20 $301.088 $359.126 932120 208A92 $208492 $359,260 359,260 $208,494 Q2 02 Q3 02 Q3 Airport - Airport Downtown Downtown Downtown ---- Airport Airport Downtown Downtown Downtown Downtown ---- Airport Airport Downtown Downtown Downtown ---- Airport Airport Downtown Downtown Downtown ---- Airport Airport Downtown Downtown Downtown Air Airport Airport Downtown Downtown Airport . Airport Downtown Downtown Airport . Airport Downtown Downtown Airport . Airport Downtown Downtown Airport . Airport Downtown Downtown Airport Airport Downtown Downtown Premium $191.58 $399,328.80 2018 29 30 Economy Airport 31 Sum of Profit Column Labels Row Labels 2017 2018 2019 Grand Total 2258779.22303560.8 2521478.4 7083818.4 1127191.2 1218772.8 1359912 3705876 Downtown Down 1131588 1084788 1161566.4 3377942.4 1483195.2 1995852.8 2114324.8 5593372.8 Airport 787636.8 1072433.6 1099191.2 2959261.6 Downtown 695558.4 923419.2 1015133.6 2634111.2 Grand Total 3741974.4 4299413.6 4635803.2 12677191.2 2018 2018 2018 2018 2019 2019 32 --- Premium 34 35 2019 2019 37 Economy Premium Economy Premium Economy Premium Economy Premium Economy Premium Economy Premium Economy Premium Economy Premium Economy Premium Economy Premium 2019 38 39 PIST. $137.48 $184.13 . $144.43 $206.75 P200.72 $106.69 . $156,60 $167.33 $253.44 $117.16 $199.36 2133.30 $ 108,26 P100.20 $166.46 $91.31 231.3 $187.30 1024 $166.48 $210.20 4.24 $131.75 $ 138,44 2130 $161.87 PIOL.07 $155.82 $193,302.40 1992 $385.900.80 22.00 $222.307.20 22221.2 $412.706,40 12.10. $168.448.00 $316.740.00 210.0.0 $235,867.20 - $547.740.00 $169,315,20 222222 $397,965.60 120. $170.928,00 PIT 2014, $336,674,40 $128,707.20 P12012 $404 803,20 - $260.306.00 $451632.00 202. $239 417.20 SA $312,738,60 1912,750.00 $239,506.80 $312,740.40 $236,938.00 h $407,193.00 2019 40 2019 2019 41 2019 2019 $752.720 2019 2019 2019 $598,543 $521,231 $598,767 $521,234 $592,345 $678,655 2019 04 04 48 Economy 2019 2019 $157.20 $355.407 49 04 Premium $180.78 $271462 50 51 52 F H T L M N o P Q R S T V W Y Z AA 1 2 B Quarter - Q1 Q1 09 Q1 Q1 Q2 C Location Airport Airport Downtown Total profit Reported Reema 1500000 4 Downtown 1000000 6 Q2 Sum of Profit Row Labels Airport Economy Premium O Downtown Economy Premium Grand Total Column Labels 2017 2018 2019 Grand Total 1914828 2291206.4 2459103.2 6665137.6 1127191.2 1218772.8 1359912 3705876 787636.8 1072433.6 1099191.2 2959261.6 1827146.4 2008207.2 2176700 6012053.6 1131588 1084788 1161566.4 3377942.4 695558.4 923419.2 1015133.6 2634111.2 3741974.4 4299413.6 4635803.2 12677191.2 500000 2017 2018 2019 Q2 0 Q2 Economy Premium Economy Premium Downtown 03 03 Airport SEOA 03 03 A Year 2017 2017 2017 2017 2047 2017 2047 2017 2017 2017 2047 2017 2017 2017 2047 2017 2017 2017 2047 2017 2047 2017 2047 2017 2047 2017 2045 2017 2017 2017 2040 2018 2040 2018 2018 2040 2018 2040 2018 2040 2018 2040 2018 2040 2018 2046 2018 2018 2018 D CarClass Economy Premium From Economy Premium Premium Economy Premium Economy Premium ___ Economy Premium Economy Premium ___ Economy Premium Economy Premium ___ Economy Premium Economy Premium Economy Premium Economy Premium Economy 9 10 10 11 12 13 14 15 16 - 17 10 18 19 20 20 21 Average Reve Reported by Reema 04 AvgRev $104.73 $109.16 $92.65 $100.97 $103.78 $106.15 $94.88 ... $102.22 $180.64 $210.07 $120.19 $134.80 $149.26 $155.65 $173.88 $193.78 $141.35 $185.23 $121.00 $152.20 4 $141.96 $184.62 $137.59 $170.10 $153.09 404 Overhead(cos $136,856.00 $209,911.20 $137,300.80 $210,636.00 C4 $168,876.8 $222,076.80 $182,169.60 $177,672.00 $232,230.40 $451,363 - $ 201,920.00 h $283,089.60 $213497 IN $298,104.00 $233,001 $371,940.00 $194,500. $420,876.00 $166,006.40 $331,394.40 $194,422.40 ---- $375,739 $195435.20 COEL $351,093.60 $201,284.86 04 04 04 $619.900 Average of Revel Column Labels 2017 2017 Row Labels 2018 2019 Grand Total Airport 480968 589046.5 626812.25 565608.917 Economy 469663 507822 566630 514705 Premium 492273 670271 686994.5 616512.833 O Downtown 453109.5 514566 559222.25 508965.917 Economy 471495 451995 483986 469158.667 Premium 434724 577137 634458.5 548773.167 Grand Total 467038.75 551806.25 593017.25 537287.417 800000 700000 600000 500000 400000 300000 200000 100000 2017 E Reven $342,140 $349,852 $ $351,060 251 080 2010 $422,192 $370,128 $455,424 $296,120 CERNE $580,576 ZE 27 $752.272 $504,800 4294 046 $471,816 24 $533,744 20 $496,840 SP $582,504 Sezon CADE 29 $486 252 2014 $701460 $415,016 $552,324 Ape EE $486,056 SE2 222 $626,232 $488,588 CERE $585,156 $503212 $665,548 $483256 $643,168 . $555,768 $687 844 $421,120 ee $527,900 $589,668 $912.900 $423,287 $663,276 $427,320 $561,124 ene $321,768 ene $674,672 $650,765 2018 2019 Q1 Q1 Q1 Q2 Economy Premium Economy Premium Airport Downtown 25 Q2 O SRB Q2 Numc 3267 3205 2705 3705 2427 3477 4000 4068 3487 2000 4800 2897 24 3214 rea 3581 4000 4200 3500 Ez 3576 400 3192 3350 400 3199 2440 3440 3787 3430 3629 2498 3424 900 3392 ACES 3551 2440 3440 2007 3287 3474 3515 3493 3848 3327 3947 00 3371 som 3524 3602 3613 3327 - 3947 3371 3524 3602 w 3909 3581 - 4543 3765 3699 3345 3768 3754 Which categories Locations or carclass are more profitable? Answer: After 25 26 27 28 Profit $205,284 $139,941 $205,951 $140,424 $253,315 $148,051 $273,254 $1184 2020 $348,346 $300,909 $302,880 $188,726 $320,246 $198,736 $349,502 $247,960 $291,751 $280,584 $249,010 $220,930 $291,634 $250,493 $293,153 $234,062 $301,927 $266,219 $289.954 1223 $257.267 $333 461 2213150 $275,138 $252,672 2012 $211,160 $353 801 $365 16 $253.973 2203310 $265,310 $256 394 $224,450 $193,061 --- $269 869 $20 $301.088 $359.126 932120 208A92 $208492 $359,260 359,260 $208,494 Q2 02 Q3 02 Q3 Airport - Airport Downtown Downtown Downtown ---- Airport Airport Downtown Downtown Downtown Downtown ---- Airport Airport Downtown Downtown Downtown ---- Airport Airport Downtown Downtown Downtown ---- Airport Airport Downtown Downtown Downtown Air Airport Airport Downtown Downtown Airport . Airport Downtown Downtown Airport . Airport Downtown Downtown Airport . Airport Downtown Downtown Airport . Airport Downtown Downtown Airport Airport Downtown Downtown Premium $191.58 $399,328.80 2018 29 30 Economy Airport 31 Sum of Profit Column Labels Row Labels 2017 2018 2019 Grand Total 2258779.22303560.8 2521478.4 7083818.4 1127191.2 1218772.8 1359912 3705876 Downtown Down 1131588 1084788 1161566.4 3377942.4 1483195.2 1995852.8 2114324.8 5593372.8 Airport 787636.8 1072433.6 1099191.2 2959261.6 Downtown 695558.4 923419.2 1015133.6 2634111.2 Grand Total 3741974.4 4299413.6 4635803.2 12677191.2 2018 2018 2018 2018 2019 2019 32 --- Premium 34 35 2019 2019 37 Economy Premium Economy Premium Economy Premium Economy Premium Economy Premium Economy Premium Economy Premium Economy Premium Economy Premium Economy Premium 2019 38 39 PIST. $137.48 $184.13 . $144.43 $206.75 P200.72 $106.69 . $156,60 $167.33 $253.44 $117.16 $199.36 2133.30 $ 108,26 P100.20 $166.46 $91.31 231.3 $187.30 1024 $166.48 $210.20 4.24 $131.75 $ 138,44 2130 $161.87 PIOL.07 $155.82 $193,302.40 1992 $385.900.80 22.00 $222.307.20 22221.2 $412.706,40 12.10. $168.448.00 $316.740.00 210.0.0 $235,867.20 - $547.740.00 $169,315,20 222222 $397,965.60 120. $170.928,00 PIT 2014, $336,674,40 $128,707.20 P12012 $404 803,20 - $260.306.00 $451632.00 202. $239 417.20 SA $312,738,60 1912,750.00 $239,506.80 $312,740.40 $236,938.00 h $407,193.00 2019 40 2019 2019 41 2019 2019 $752.720 2019 2019 2019 $598,543 $521,231 $598,767 $521,234 $592,345 $678,655 2019 04 04 48 Economy 2019 2019 $157.20 $355.407 49 04 Premium $180.78 $271462 50 51 52


