

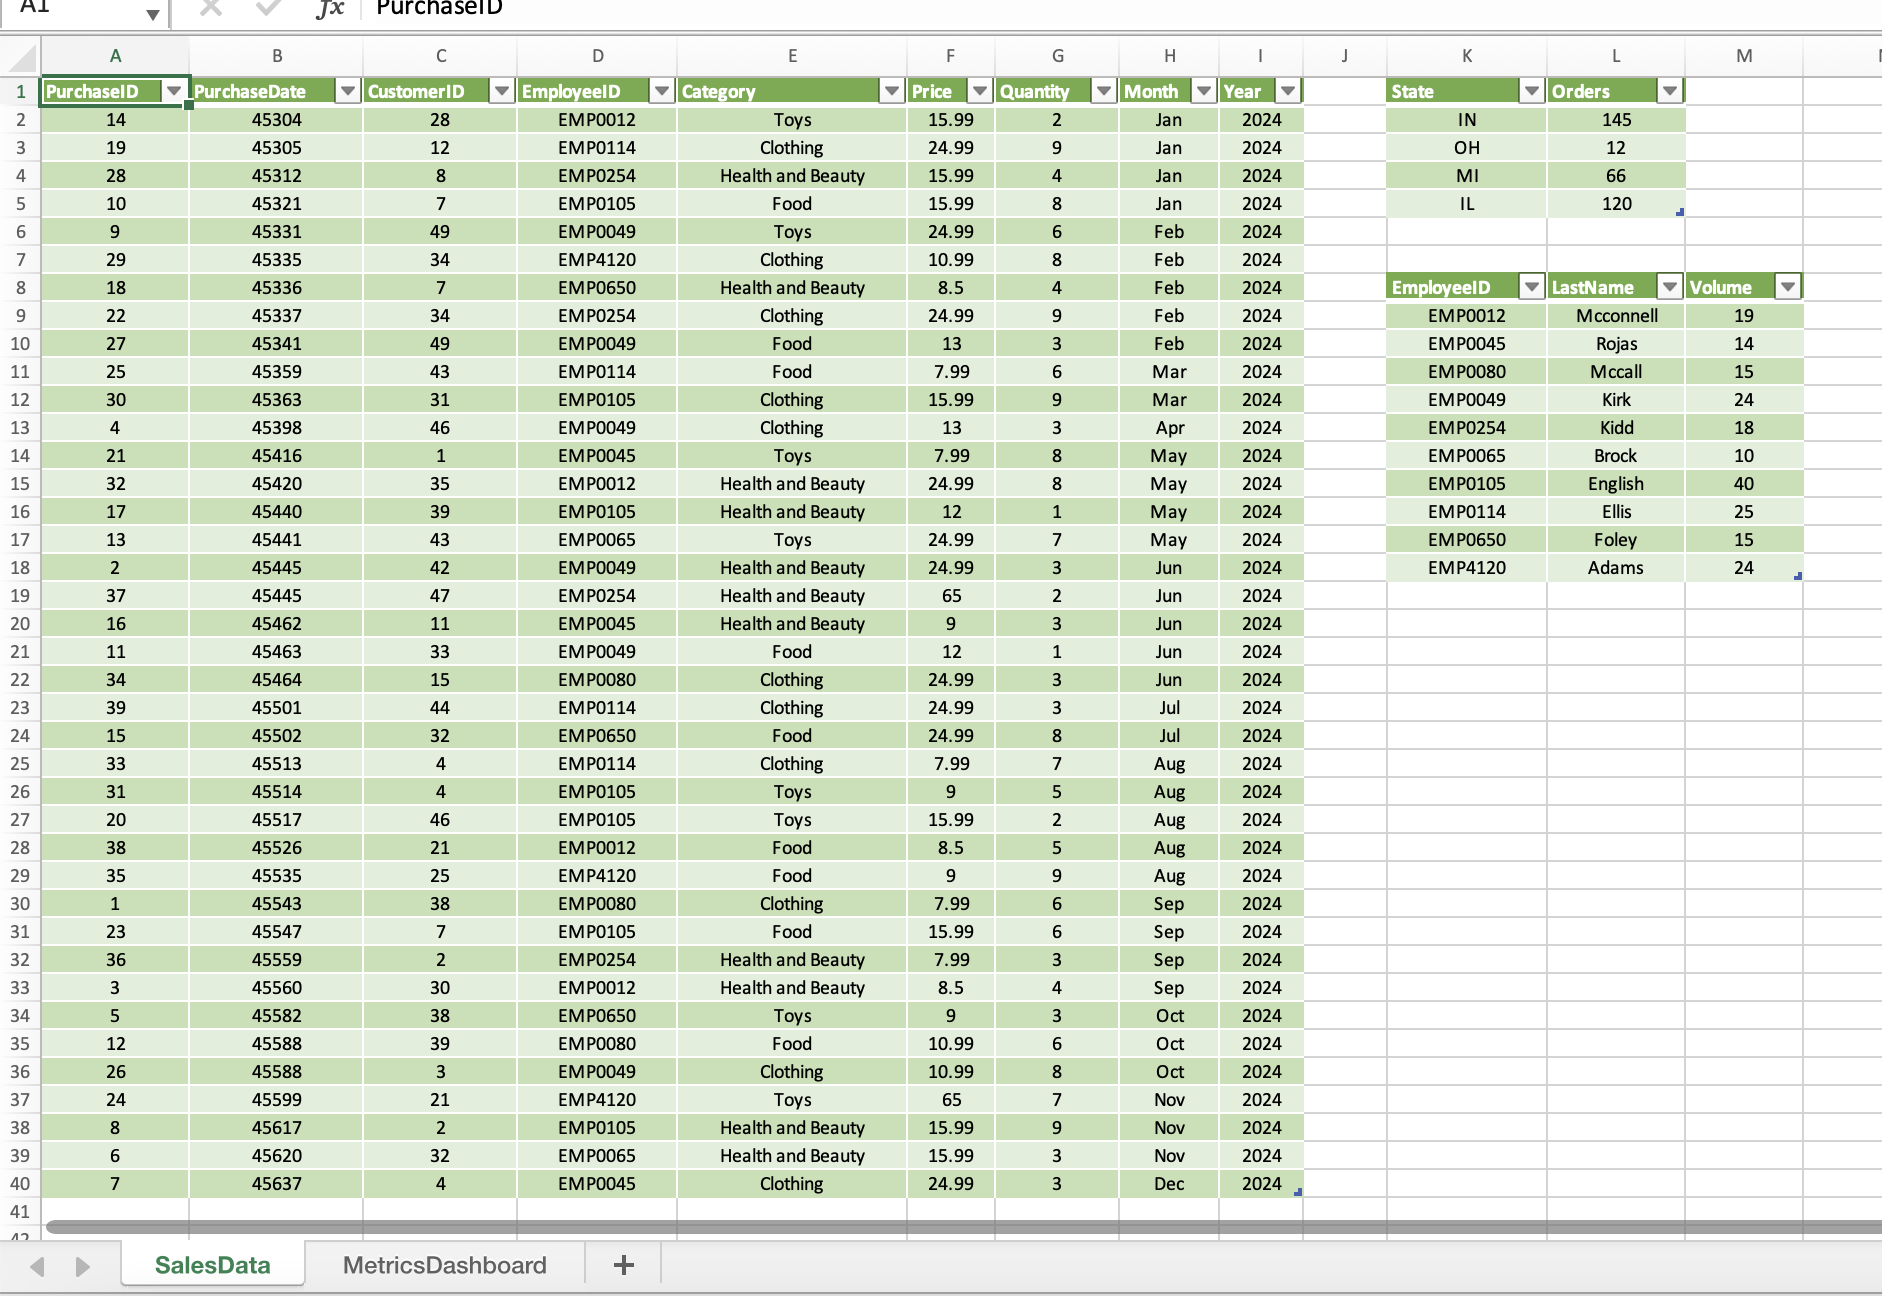
Question: From the OrdersbyState Power Pivot window, create a second PivotTable on the MetricsDashboard worksheet in cell I25. Drag the State field from OrdersByState to the
| From the OrdersbyState Power Pivot window, create a second PivotTable on the MetricsDashboard worksheet in cell I25. Drag the State field from OrdersByState to the Rows area and the Population field to the Values area. Convert the PivotTable to formulas. | 3 |
| 12 | Insert a second Filled Map chart to the MetricsDashboard worksheet using cells I25:J29, and complete the following. Change the chart title to Population by State. Position the map within the cell range I25:M39. |
| 13 | Prepare the dashboard for production by hiding the SalesData worksheet. Hide the column and row headings as well as the gridlines on the MetricsDashboard worksheet. |
| 14 | Minimize the ribbon. Protect the worksheet, allowing only to Use PivotTable & PivotChart and Edit objects. |
Need help with these steps please provide detaileld step by step instructions
SalesData MetricsDashboard
Step by Step Solution
There are 3 Steps involved in it
1 Expert Approved Answer
Step: 1 Unlock

Question Has Been Solved by an Expert!
Get step-by-step solutions from verified subject matter experts
Step: 2 Unlock
Step: 3 Unlock