

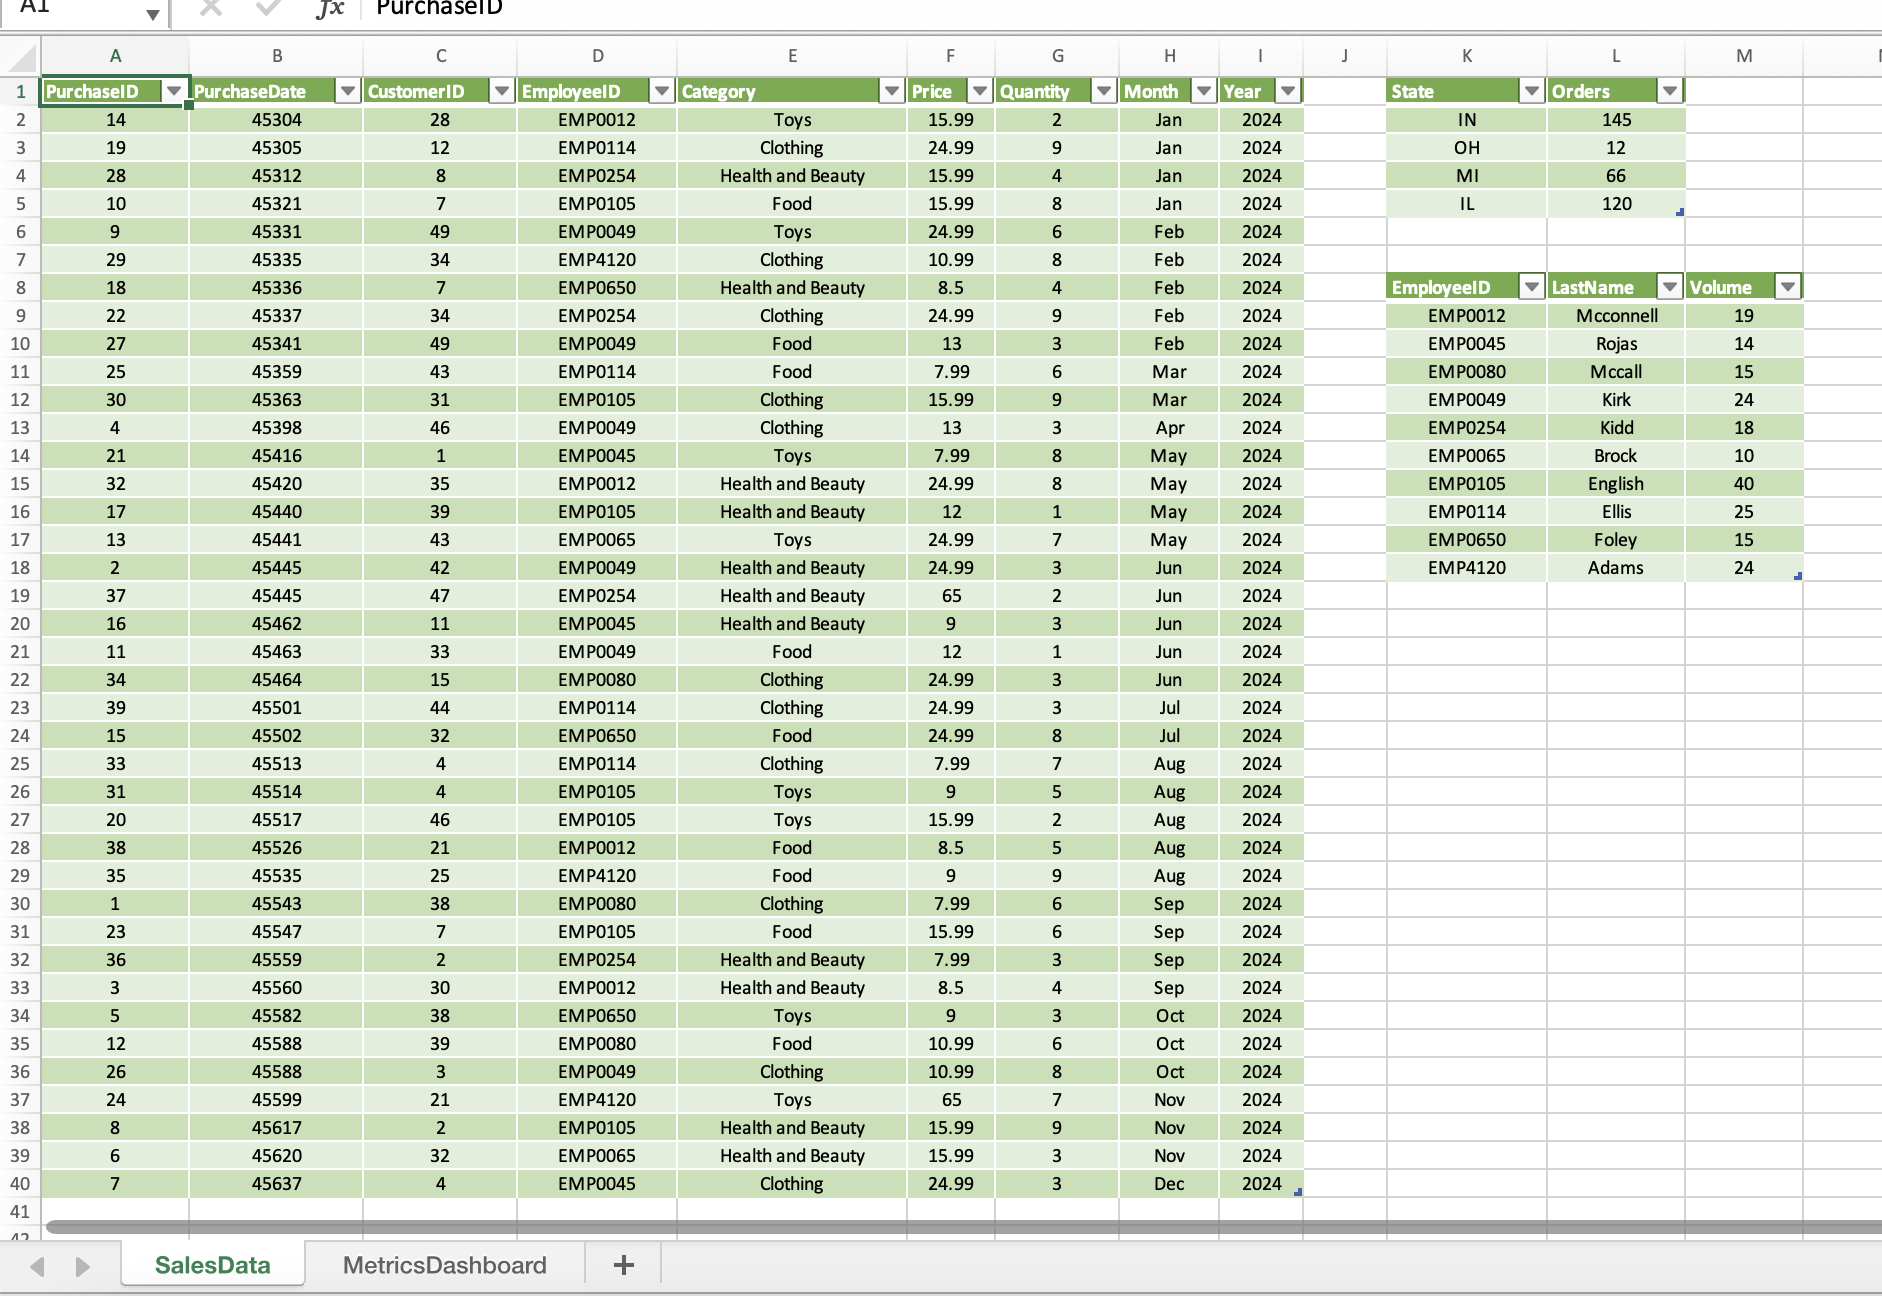
Question: From the Power Pivot window, create a PivotTable on the MetricsDashboard worksheet in cell B25. Drag the State field from OrdersByState to the Rows area
| From the Power Pivot window, create a PivotTable on the MetricsDashboard worksheet in cell B25. Drag the State field from OrdersByState to the Rows area and the Orders field to the Values area. Convert the PivotTable to formulas. Change the label in cell B25 to State. | 3 |
| 10 | Insert a Filled Map chart to the MetricsDashboard worksheet using cells B25:C29, and complete the following. Change the chart title to Number of Orders by State. Position the map within the cell range B25:H39. |
Need help with these steps can you please provide detailed step by step walk through
SalesData MetricsDashboard
Step by Step Solution
There are 3 Steps involved in it
1 Expert Approved Answer
Step: 1 Unlock

Question Has Been Solved by an Expert!
Get step-by-step solutions from verified subject matter experts
Step: 2 Unlock
Step: 3 Unlock