

Question: help with #2 pleasee 1. Modified problem 1.28 from Hydrology and Floodplain Analysis. For the rainfall record provided below, plot cumulative rainfall (P) and gross
help with #2 pleasee 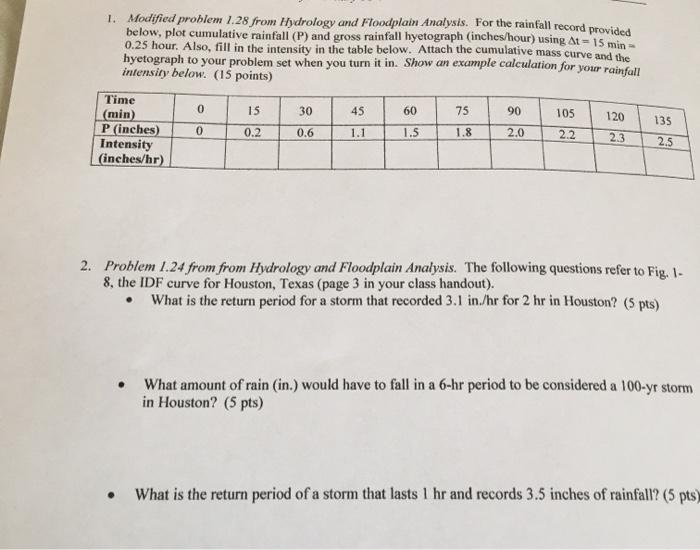
1. Modified problem 1.28 from Hydrology and Floodplain Analysis. For the rainfall record provided below, plot cumulative rainfall (P) and gross rainfall hyetograph (inches/hour) using At = 15 min 0.25 hour. Also, fill in the intensity in the table below. Attach the cumulative mass curve and the hyetograph to your problem set when you turn it in. Show an example calculation for your rainfall intensity below. (15 points) Time 0 30 60 (min) 75 105 120 P (inches) 0.2 1.1 1.5 2.0 Intensity (inches/hr) 15 45 90 135 0 0.6 1.8 2.2 2.3 2.5 2. Problem 1.24 from from Hydrology and Floodplain Analysis. The following questions refer to Fig. 1- 8. the IDF curve for Houston, Texas (page 3 in your class handout). What is the return period for a storm that recorded 3.1 in./hr for 2 hr in Houston? (5 pts) . What amount of rain (in.) would have to fall in a 6-hr period to be considered a 100-yr storm in Houston? (5 pts) What is the return period of a storm that lasts 1 hr and records 3.5 inches of rainfall? (5 pts) Step by Step Solution
There are 3 Steps involved in it
1 Expert Approved Answer
Step: 1 Unlock

Question Has Been Solved by an Expert!
Get step-by-step solutions from verified subject matter experts
Step: 2 Unlock
Step: 3 Unlock