

Question: help with part b. An automatic lathe produces rollers for roller bearings, and the process is mignitored by statistical process control charts. The central line
help with part b. 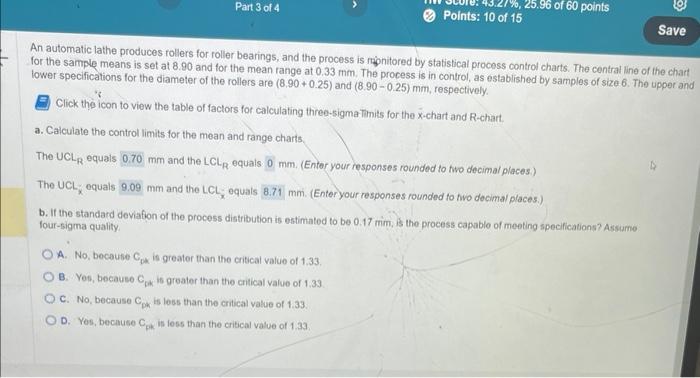
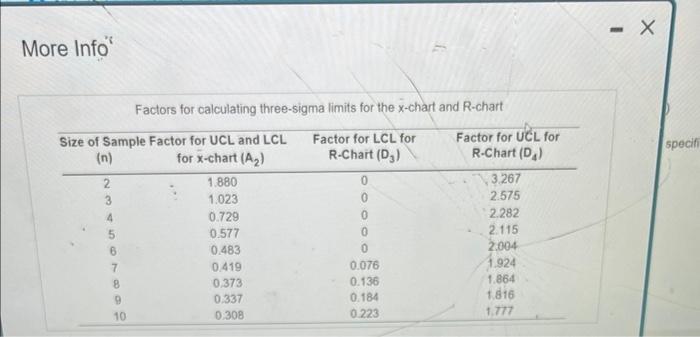
An automatic lathe produces rollers for roller bearings, and the process is mignitored by statistical process control charts. The central line of the chart for the sample means is set at 8.90 and for the mean range at 0.33mm. The process is in control, as established by samples of size 6 . The upper anc lower specifications for the diameter of the rollers are (8.90+0.25) and (8.900.25)mm, respectively. Click the icon to view the table of factors for calculating three-sigmatinits for the x-chart and R-chart a. Caiculate the control limits for the mean and range charts. The ULR equals mm and the LCLR equals. mm. (Entor your responses rounded to two decimal places.) The UCL Xequalsmm and the LCL; equals mm. (Enter your responses rounded to hiv decimal places.) b. If the standard deviafion of the process distribution is estimated to be 0.17mim, is the process capablo of meoting specfications? Assume four-sigma quality. A. No, because Cpi is greater than the critical value of 1.33. B. Yes, because Cgik is greater than the critical value of 1.33. C. No, because Cpk is less than the critical value of 1.33. D. Yes, because Cpik is less than the critical value of 1.33. More Info" Factors for calculating three-sigma limits for the x-chart and R-char
Step by Step Solution
There are 3 Steps involved in it
1 Expert Approved Answer
Step: 1 Unlock

Question Has Been Solved by an Expert!
Get step-by-step solutions from verified subject matter experts
Step: 2 Unlock
Step: 3 Unlock