

Question: Here how he solved the first part https://www.chegg.com/homework-help/questions-and-answers/q2-plot-p-chart-following-find-ucl-lcl-cl-draw-revised-chart-limit-found-control-limits-lo-q60247980 Q2. Plot a P chart for the following find UCL, LCL,CL and Draw revised chart if limit
Here how he solved the first part
https://www.chegg.com/homework-help/questions-and-answers/q2-plot-p-chart-following-find-ucl-lcl-cl-draw-revised-chart-limit-found-control-limits-lo-q60247980
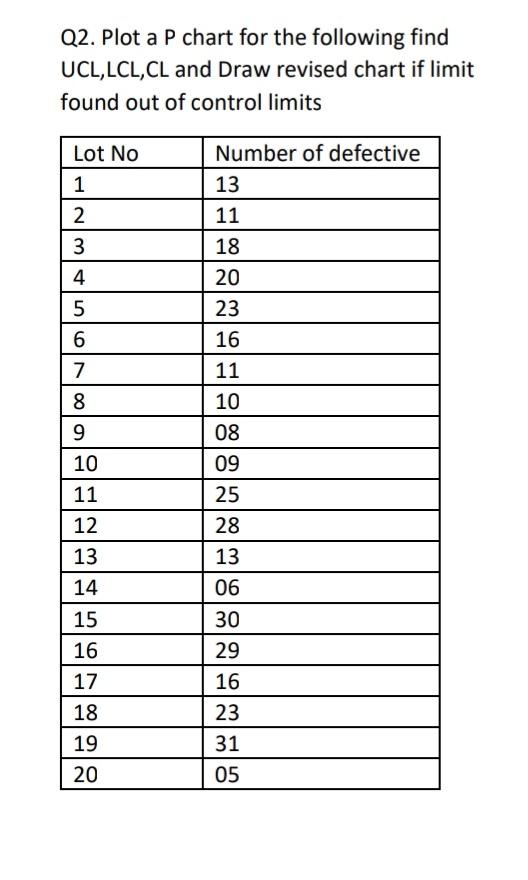
Q2. Plot a P chart for the following find UCL, LCL,CL and Draw revised chart if limit found out of control limits Lot No 1 Number of defective 13 2 11 3 4 5 18 20 23 16 11 6 7 8 10 11 12 13 14 15 16 10 08 09 25 28 13 06 30 17 18 19 20 29 16 23 31 05 Q2. Plot a P chart for the following find UCL, LCL,CL and Draw revised chart if limit found out of control limits Lot No 1 Number of defective 13 2 11 3 4 5 18 20 23 16 11 6 7 8 10 11 12 13 14 15 16 10 08 09 25 28 13 06 30 17 18 19 20 29 16 23 31 05
Step by Step Solution
There are 3 Steps involved in it
1 Expert Approved Answer
Step: 1 Unlock

Question Has Been Solved by an Expert!
Get step-by-step solutions from verified subject matter experts
Step: 2 Unlock
Step: 3 Unlock