

Question: n Part of the speciation graph of a commonly used red food dye is shown below. The molecular structures of both species whose concentrations are
 n
n 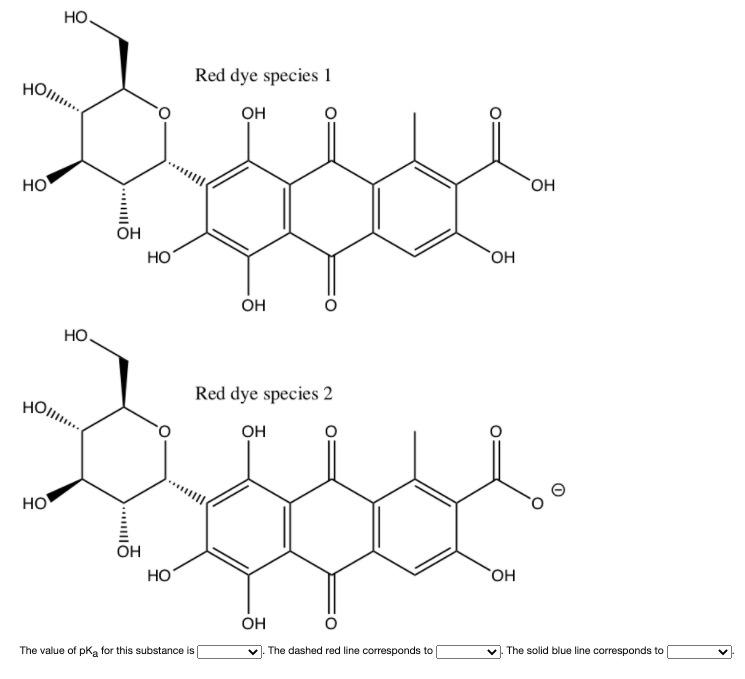
Part of the speciation graph of a commonly used red food dye is shown below. The molecular structures of both species whose concentrations are graphed are also given below as species 1 and species 2. Identify which species corresponds to which line and what is the value of pka. Red food dye speciation at different pH values % Species 100 90 80 70 60 50 40 30 20 10 0 0 1 2 PH 3 4 LO 5 ......... HO . ......... OH OH HO Red dye species 1 OH The value of pka for this substance is OH Red dye species 2 OH OH The dashed red line corresponds to OH OH OH The solid blue line corresponds to
Step by Step Solution
3.33 Rating (156 Votes )
There are 3 Steps involved in it

Get step-by-step solutions from verified subject matter experts