

Question: how do I do the calculations for these spectropic data (t) = D. (1 - exp(-ar-))?? -1 where a is an empirical constant. Molecular vibrational
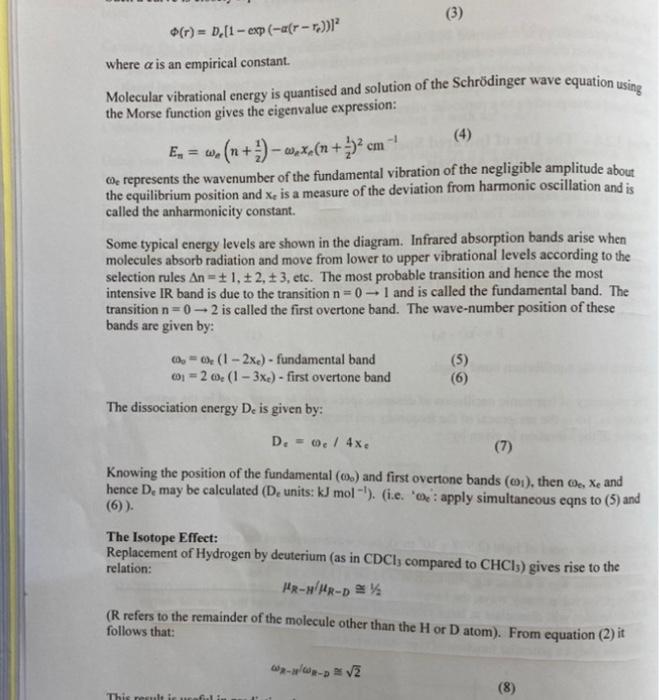
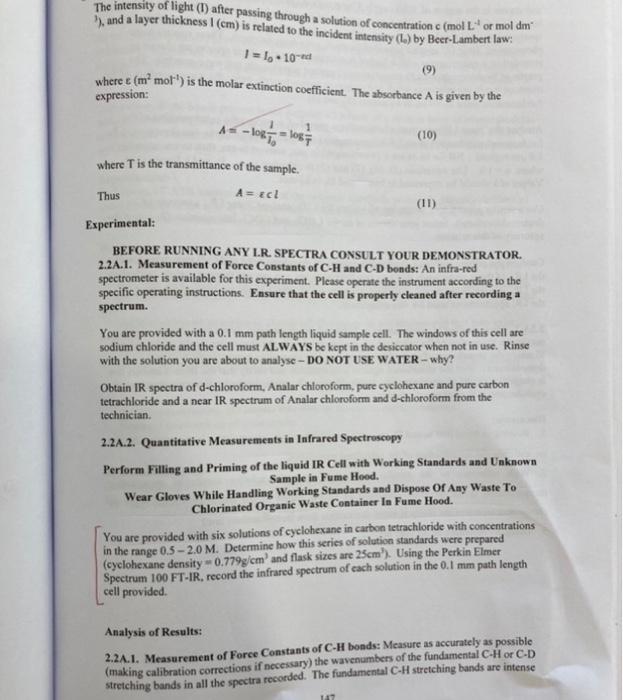
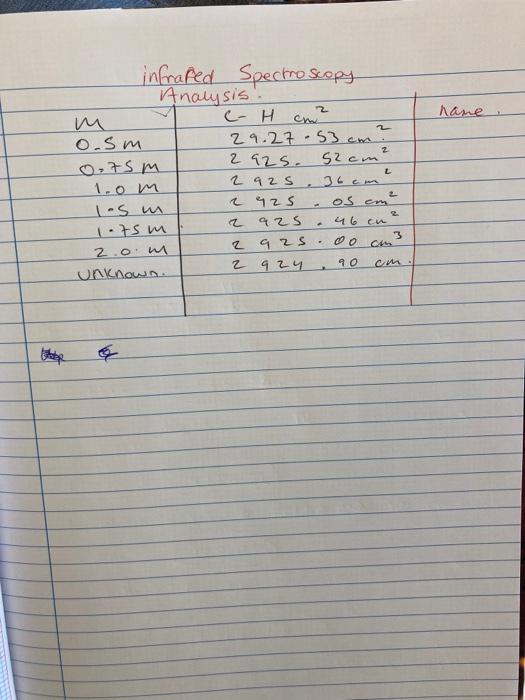
(t) = D. (1 - exp(-ar-))?? -1 where a is an empirical constant. Molecular vibrational energy is quantised and solution of the Schrdinger wave equation using the Morse function gives the eigenvalue expression: Ex = w. (n+3) -wxe(n+ 2 cm -! Me represents the wavenumber of the fundamental vibration of the negligible amplitude about the equilibrium position and xe is a measure of the deviation from harmonic oscillation and is called the anharmonicity constant. Some typical energy levels are shown in the diagram. Infrared absorption bands arise when molecules absorb radiation and move from lower to upper vibrational levels according to the selection rules An=+1, +2, +3, etc. The most probable transition and hence the most intensive IR band is due to the transition n = 0 - 1 and is called the fundamental band. The transition n = 0 -- 2 is called the first overtone band. The wave-number position of these bands are given by: - (% - 0 (1 - 2xe) - fundamental band 1 = 2 (1 - 3xe) - first overtone band (5) (6) The dissociation energy De is given by: D = 0 / 4x (7) Knowing the position of the fundamental (..) and first overtone bands (001), then , Xe and hence D. may be calculated (De units: kJ mol-'). (.e. ' : apply simultaneous eqns to (5) and (6)). The Isotope Effect: Replacement of Hydrogen by deuterium (as in CDCl, compared to CHCI) gives rise to the relation: HR-/HR- (R refers to the remainder of the molecule other than the H or Datom). From equation (2) it follows that: 2 * - (8) This result a The intensity of light (1) after passing through a solution of concentration c (mol L or moldim ), and a layer thickness 1 (cm) is related to the incident intensity (L.) by Beer-Lambert law: 1 = 1.100 (9) where t (mmol) is the molar extinction coefficient. The absorbance A is given by the expression: A-1087 -105 (10) where is the transmittance of the sample. A = ECE Thus (11) Experimental: BEFORE RUNNING ANY LR. SPECTRA CONSULT YOUR DEMONSTRATOR 2.2A.1. Measurement of Force Constants of C-H and C-D bonds: An infra-red spectrometer is available for this experiment. Please operate the instrument according to the specific operating instructions. Ensure that the cell is properly cleaned after recording a spectrum. You are provided with a 0.1 mm path length liquid sample cell. The windows of this cell are sodium chloride and the cell must ALWAYS be kept in the desiccator when not in use. Rinse with the solution you are about to analyse - DO NOT USE WATER - why? Obtain IR spectra of d-chloroform, Analar chloroform, pure cyclohexane and pure carbon tetrachloride and a near IR spectrum of Analar chloroform and d-chloroform from the technician 2.24.2. Quantitative Measurements in Infrared Spectroscopy Perform Filling and Priming of the liquid IR Cell with Working Standards and Unknown Sample in Fume Hood. Wear Gloves While Handling Working Standards and Dispose of Any Waste To Chlorinated Organic Waste Container In Fume Hood. You are provided with six solutions of cyclohexane in carbon tetrachloride with concentrations in the range 0.5 -2.0 M. Determine how this series of solution standards were prepared (cyclohexane density -0.779g/cm and flask sizes are 25cm'). Using the Perkin Elmer Spectrum 100 FT-IR, record the infrared spectrum of each solution in the 0.1 mm path length cell provided. Analysis of Results: 2.24.1. Measurement of Force Constants of C-H bonds: Measure as accurately as possible (making calibration corrections if necessary) the wavenumbers of the fundamental C-H or CD stretching bands in all the spectra recorded. The fundamental C-H stretching bands are intense 167 name 2 infrared Spectroscopy Analysis. C-H cm o.sm 29.27.53cm? 0,75 m 2925. S2cm 1.0 m 2 925 36cm 1.5 m 2 925 1.75m 2 925 2.0 2 92s Unknown 2 924 L 2 os em 46 cu 3 oo 90 E
Step by Step Solution
There are 3 Steps involved in it

Get step-by-step solutions from verified subject matter experts