

Question: how to get the numbers from the Balance sheet? (TABLE5) $ 2947 150 EBIT = letore interst and texen (P=32= A/RX350 ) 32rsales 360 Table
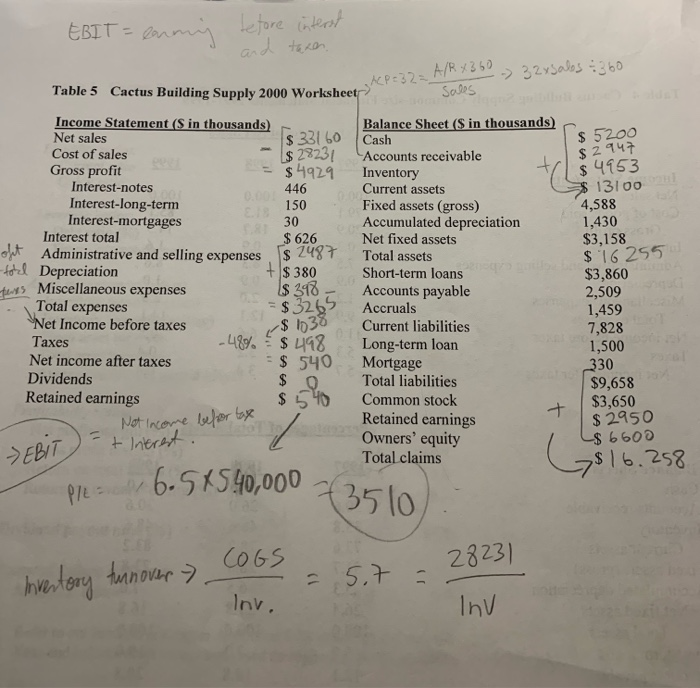
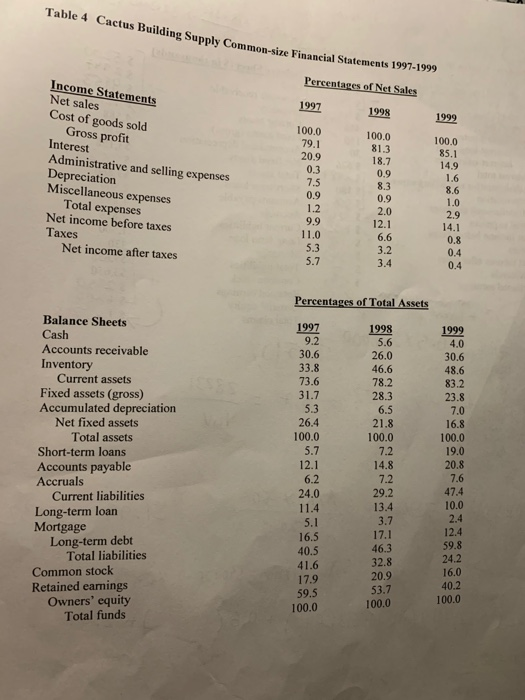
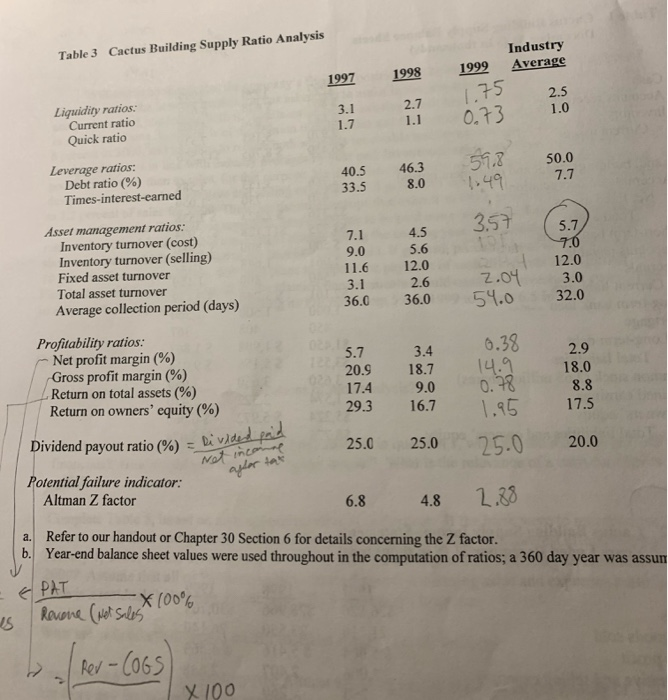
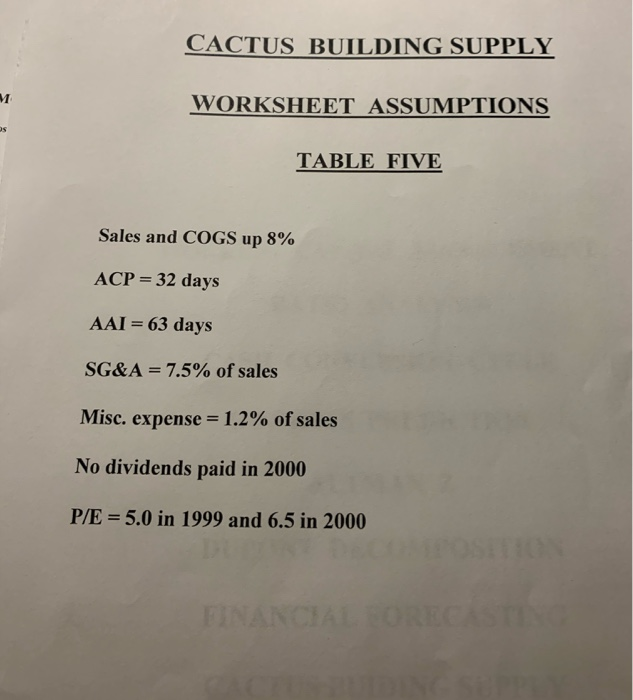
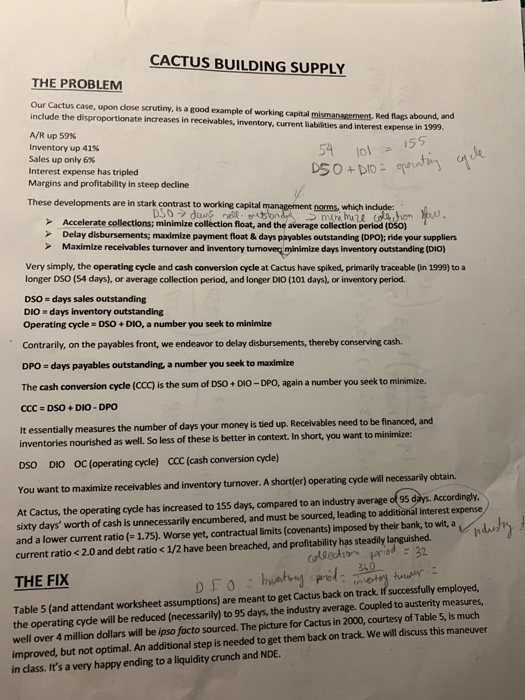
$ 2947 150 EBIT = letore interst and texen (P=32= A/RX350 ) 32rsales 360 Table 5 Cactus Building Supply 2000 Worksheet Sois Income Statement (S in thousands) Balance Sheet (S in thousands) Net sales Is 33160 Cash $ 5200 Cost of sales $ 28231 Accounts receivable Gross profit $4929 Inventory $4953 Interest-notes 446 Current assets $ 13100 Interest-long-term Fixed assets (gross) 4,588 Interest-mortgages 30 Accumulated depreciation 1,430 Interest total $ 626 Net fixed assets $3,158 oft Administrative and selling expenses Is 2487 Total assets $ 16 255 -Hohe Depreciation + $ 380 Short-term loans $3,860 295 Miscellaneous expenses $ 398 Accounts payable 2,509 Total expenses = $ 3265 Accruals 1,459 Net Income before taxes - $ 1038 Current liabilities 7,828 Taxes -48% $ 498 Long-term loan 1,500 Net income after taxes = $540 Mortgage 330 Dividends $ 0 Total liabilities $9,658 Retained earnings Common stock $3,650 Retained earnings $ 2950 Owners' equity L$ 6600 Total claims $16.258 Not income befor tax -t interest EBIT Ple= 6.545.40,000 -3 Invertory turnover 28231 COGS = 57 - Inv. Inv Table 4 Cactus Building Supply Common-size Financial Statements 1997-19 Percentages of Net Sales 1997 1998 1999 Income Statements Net sales Cost of goods sold Gross profit Interest Administrative and selling expenses Depreciation Miscellaneous expenses Total expenses Net income before taxes Taxes Net income after taxes 100.0 79.1 20.9 0.3 100.0 81.3 18.7 0.9 8.3 7.5 0.9 0.9 100.0 85.1 14.9 1.6 8.6 1.0 29 14.1 0.8 0.4 2.0 12.1 9.9 11.0 5.3 5.7 6.6 3.4 0.4 Percentages of Total Assets 1997 92 30.6 33.8 73.6 1998 5.6 26.0 46.6 78.2 28.3 1999 4.0 30.6 48.6 83.2 23.8 31.7 5.3 6.5 7.0 26.4 100.0 5.7 Balance Sheets Cash Accounts receivable Inventory Current assets Fixed assets (gross) Accumulated depreciation Net fixed assets Total assets Short-term loans Accounts payable Accruals Current liabilities Long-term loan Mortgage Long-term debt Total liabilities Common stock Retained earnings Owners' equity Total funds 21.8 100.0 7.2 14.8 7.2 29.2 13.4 12.1 6.2 24.0 11.4 5.1 16.5 40.5 41.6 17.9 59.5 100.0 16.8 100.0 19.0 20.8 7.6 47.4 10.0 2.4 12.4 59.8 24.2 16.0 40.2 3.7 17.1 46.3 32.8 20.9 53.7 100.0 100.0 Table 3 Cactus Building Supply Ratio Analysis Industry Average 1999 1998 1997 1.75 2.5 1.0 2.7 3.1 0.73 1.1 Liquidity ratios. Current ratio Quick ratio 1.7 Leverage ratios: Debt ratio (%) Times-interest-earned 40.5 33.5 46.3 8.0 59.8 1.49 50.0 7.7 Asset management ratios." Inventory turnover (cost) Inventory turnover (selling) Fixed asset turnover Total asset turnover Average collection period (days) 7.1 9.0 11.6 3.1 36.0 4.5 5.6 12.0 2.6 36.0 3.57 5.7 17.0 12.0 2.04 54.0 3.0 32.0 0.38 5.7 2.9 14.9 18.0 Profitability ratios: Net profit margin (%) Gross profit margin (%) Return on total assets (%) Return on owners' equity (%) 20.9 17.4 29.3 3.4 18.7 9.0 16.7 8.8 17.5 0.78 1.95 25.0 Dividend payout ratio (%) = 25.0 25.0 20.0 Put ratio (%) = Rivided peid Net income Potential failure indicator: Altman Z factor 6.8 4.8 2.88 a. Refer to our handout or Chapter 30 Section 6 for details concerning the Z factor. b. Year-end balance sheet values were used throughout in the computation of ratios; a 360 day year was assun EPAT Revena (Not Sale x 100% Rev-COGS X 100 CACTUS BUILDING SUPPLY WORKSHEET ASSUMPTIONS TABLE FIVE Sales and COGS up 8% ACP = 32 days AAI = 63 days SG&A = 7.5% of sales Misc. expense = 1.2% of sales No dividends paid in 2000 P/E = 5.0 in 1999 and 6.5 in 2000 CACTUS BUILDING SUPPLY THE PROBLEM Our Cactus case, upon close scrutiny, is a good example of working capital mismanagement, Red flags abound, and include the disproportionate increases in receivables, inventory, current liabilities and interest expense in 1999. A/R up 59% Inventory up 41% Sales up only 6% Interest expense has tripled Margins and profitability in steep decline These developments are in stark contrast to working capital management norms, which include: DSD dous sondy muniture de Dion puu. > Accelerate collections, minimize collection float, and the average collection period (050) Delay disbursements; maximize payment float & days payables outstanding (DPO); ride your suppliers > Maximize receivables turnover and Inventory tumovec minimize days inventory outstanding (10) 34 101 s 155 D50 + DIO = operating eque Very simply, the operating cycle and cash conversion cycle at Cactus have spiked, primarily traceable (in 1999) to a longer DSO (54 days), or average collection period, and longer DIO (101 days), or inventory period. DSO = days sales outstanding DIO = days inventory outstanding Operating cycle-DSODIO, a number you seek to minimize Contrarily, on the payables front, we endeavor to delay disbursements, thereby conserving cash. DPO = days payables outstanding a number you seek to maximize The cash conversion cycle (CCC) is the sum of DSODIO - DPO, again a number you seek to minimize. CCC EDSO+DIO-DPO It essentially measures the number of days your money is tied up. Receivables need to be financed, and inventories nourished as well. So less of these is better in context. In short, you want to minimize: DSO DIO OC (operating cycle) CCC (cash conversion cycle) wil 360 You want to maximize receivables and inventory turnover. A short(er) operating cycle will necessarily obtain. At Cactus, the operating cycle has increased to 155 days, compared to an industry average of 95 days. Accordingly, sixty days' worth of cash is unnecessarily encumbered, and must be sourced, leading to additional interest expense and a lower current ratio - 1.75). Worse yet, contractual limits (covenants) imposed by their bank, to wit, a current ratio Accelerate collections, minimize collection float, and the average collection period (050) Delay disbursements; maximize payment float & days payables outstanding (DPO); ride your suppliers > Maximize receivables turnover and Inventory tumovec minimize days inventory outstanding (10) 34 101 s 155 D50 + DIO = operating eque Very simply, the operating cycle and cash conversion cycle at Cactus have spiked, primarily traceable (in 1999) to a longer DSO (54 days), or average collection period, and longer DIO (101 days), or inventory period. DSO = days sales outstanding DIO = days inventory outstanding Operating cycle-DSODIO, a number you seek to minimize Contrarily, on the payables front, we endeavor to delay disbursements, thereby conserving cash. DPO = days payables outstanding a number you seek to maximize The cash conversion cycle (CCC) is the sum of DSODIO - DPO, again a number you seek to minimize. CCC EDSO+DIO-DPO It essentially measures the number of days your money is tied up. Receivables need to be financed, and inventories nourished as well. So less of these is better in context. In short, you want to minimize: DSO DIO OC (operating cycle) CCC (cash conversion cycle) wil 360 You want to maximize receivables and inventory turnover. A short(er) operating cycle will necessarily obtain. At Cactus, the operating cycle has increased to 155 days, compared to an industry average of 95 days. Accordingly, sixty days' worth of cash is unnecessarily encumbered, and must be sourced, leading to additional interest expense and a lower current ratio - 1.75). Worse yet, contractual limits (covenants) imposed by their bank, to wit, a current ratio
Step by Step Solution
There are 3 Steps involved in it

Get step-by-step solutions from verified subject matter experts