

Question: I need help to understand this using excel, the paper have the answers but how do I get them using excel pls help Practice 2
I need help to understand this using excel, the paper have the answers but how do I get them using excel pls help
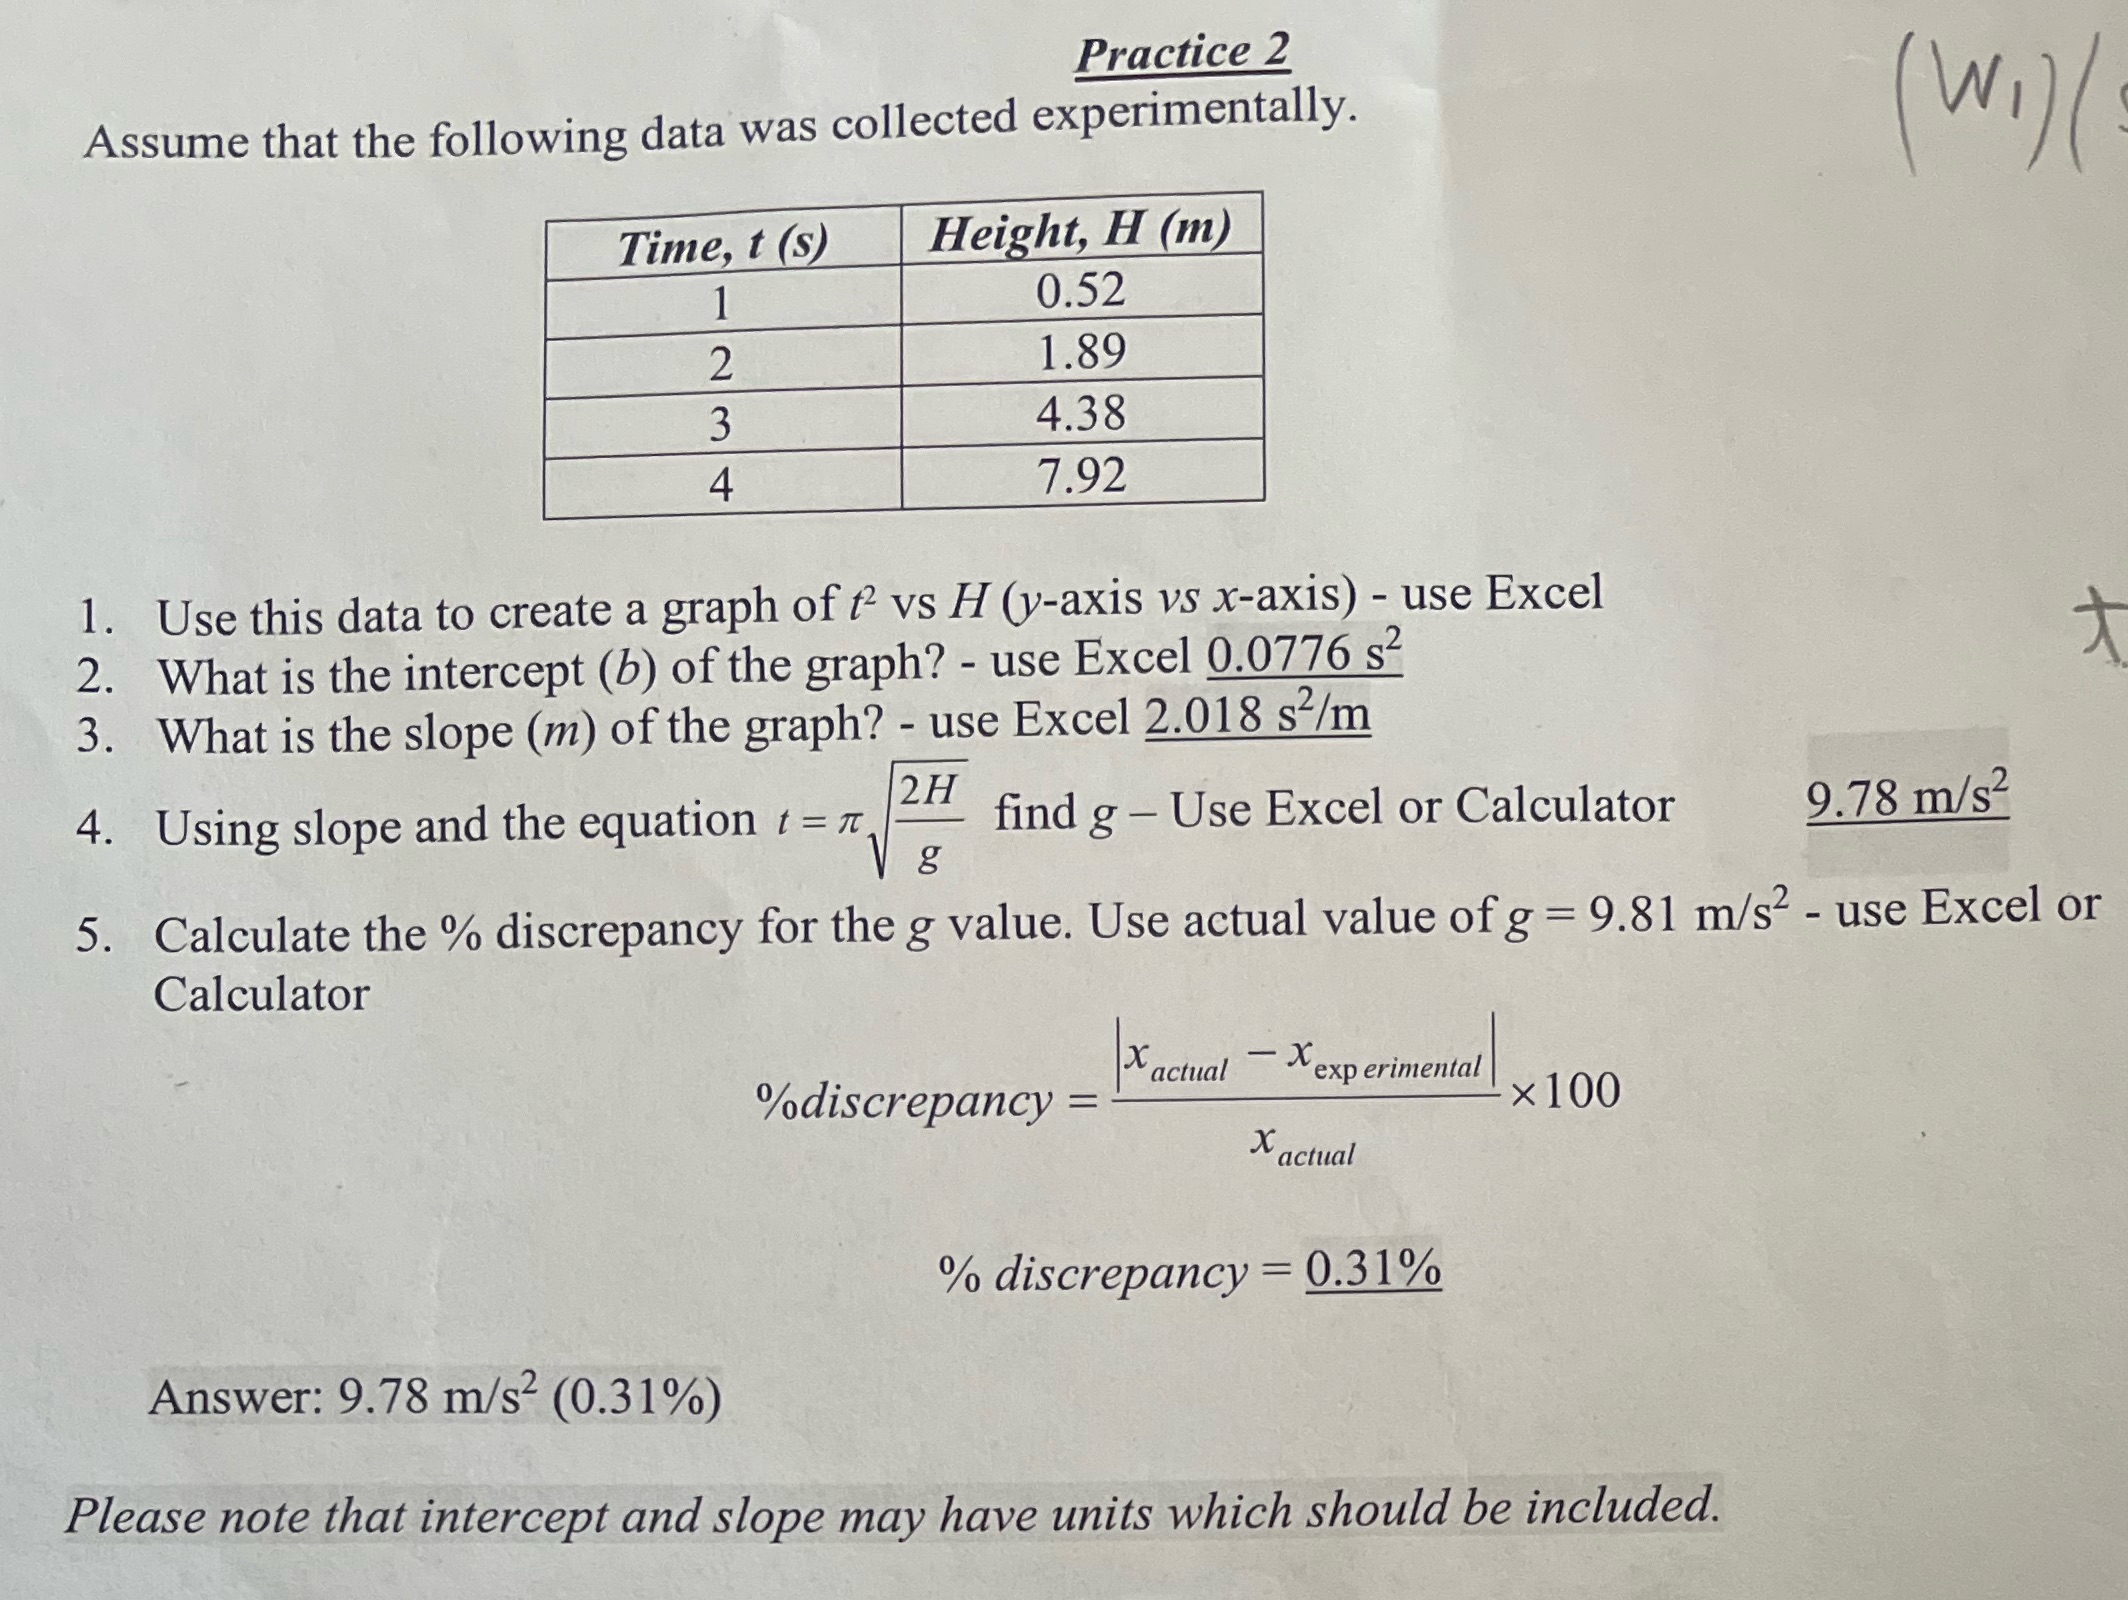
Practice 2 Assume that the following data was collected experimentally. Time, t (s) Height, H (m) 1 0.52 2 1.89 3 4.38 4 7.92 1. Use this data to create a graph of ? vs H (y-axis vs x-axis) - use Excel 2. What is the intercept (b) of the graph? - use Excel 0.0776 s2 3. What is the slope (m) of the graph? - use Excel 2.018 s2/m 4. Using slope and the equation t = 7 2H V g find g - Use Excel or Calculator 9.78 m/s2 5. Calculate the % discrepancy for the g value. Use actual value of g = 9.81 m/s2 - use Excel or Calculator %discrepancy = X actual - Xexperimental x 100 X actual % discrepancy = 0.31% Answer: 9.78 m/s2 (0.31%) Please note that intercept and slope may have units which should be included
Step by Step Solution
There are 3 Steps involved in it

Get step-by-step solutions from verified subject matter experts