

Question: I need the answers to this please Using the sampling distribution shown in Figure 1, indicate whether each sample proportion is (i) reasonably likely to
I need the answers to this please
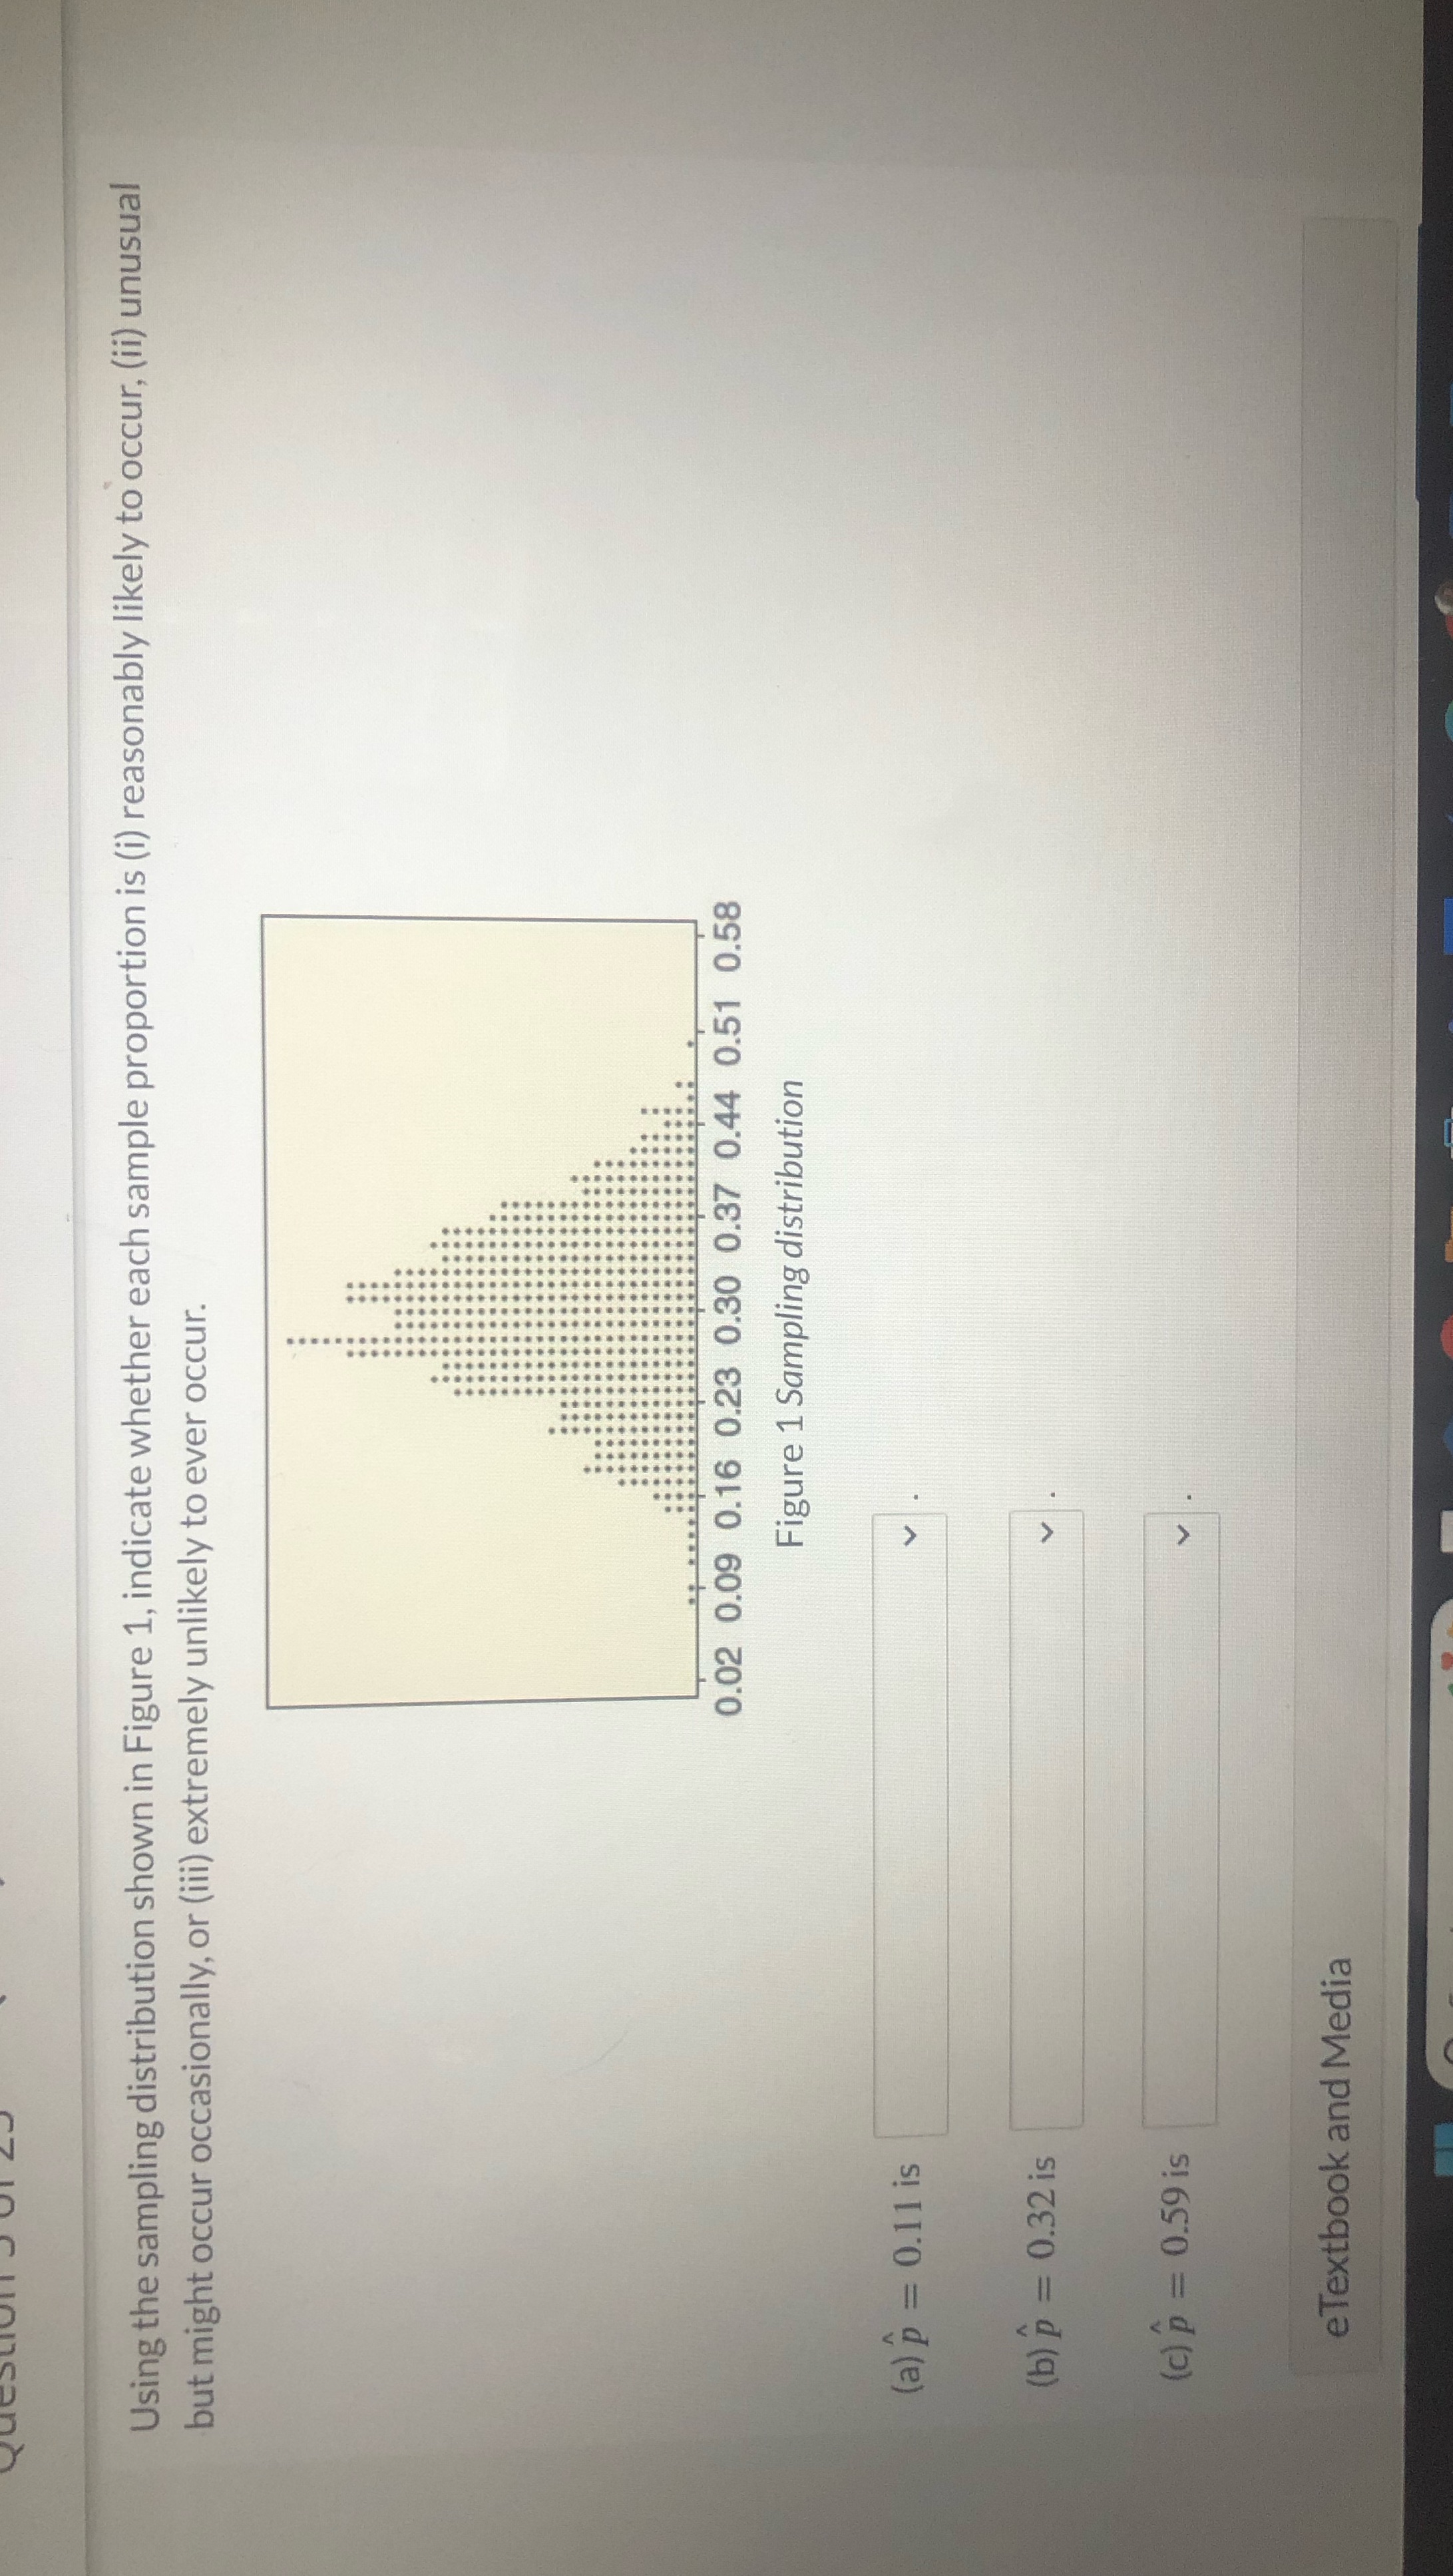
Using the sampling distribution shown in Figure 1, indicate whether each sample proportion is (i) reasonably likely to occur, (ii) unusual but might occur occasionally, or (iii) extremely unlikely to ever occur. 0.02 0.09 0.16 0.23 0.30 0.37 0.44 0.51 0.58 Figure 1 Sampling distribution (a) p = 0.11 is (b) p = 0.32 is (c) p = 0.59 is eTextbook and Media
Step by Step Solution
There are 3 Steps involved in it
1 Expert Approved Answer
Step: 1 Unlock

Question Has Been Solved by an Expert!
Get step-by-step solutions from verified subject matter experts
Step: 2 Unlock
Step: 3 Unlock