

Question: Using the sampling distribution shown in Figure 1, indicate whether each sample proportion is (i) reasonably likely to occur from a sample of size n=
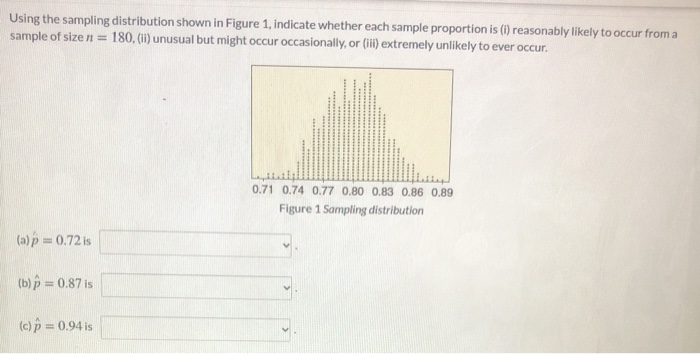
Using the sampling distribution shown in Figure 1, indicate whether each sample proportion is (i) reasonably likely to occur from a sample of size n= 180.(ii) unusual but might occur occasionally, or (ill) extremely unlikely to ever occur. 0.71 0.74 0.77 0.80 0.83 0.86 0.89 Figure 1 Sampling distribution (a)p=0.72 is (b)P = 0.87 is (c) = 0.94 is
Step by Step Solution
There are 3 Steps involved in it
1 Expert Approved Answer
Step: 1 Unlock

Question Has Been Solved by an Expert!
Get step-by-step solutions from verified subject matter experts
Step: 2 Unlock
Step: 3 Unlock