

Question: I need to how to solve each question and be explain why the answer is right. Operations & Supply Chain Management, Spring 2021 Name: Associate
I need to how to solve each question and be explain why the answer is right.
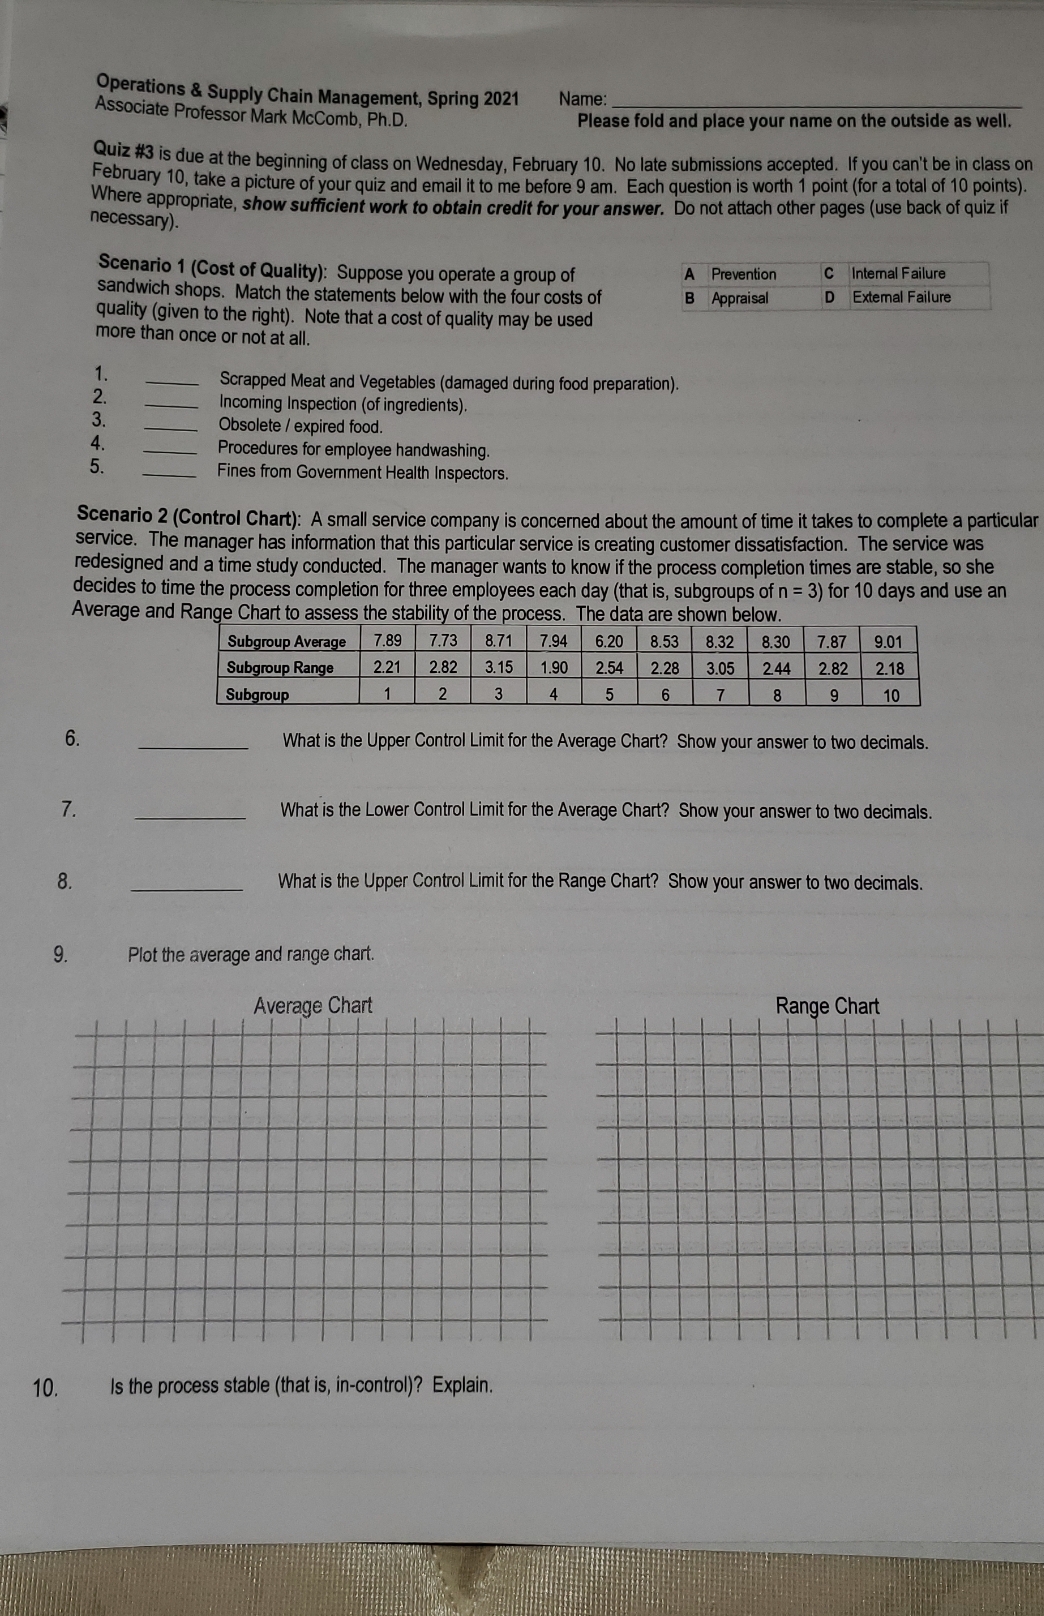
Operations & Supply Chain Management, Spring 2021 Name: Associate Professor Mark Mccomb, Ph.D. Please fold and place your name on the outside as well. Quiz #3 is due at the beginning of class on Wednesday, February 10. No late submissions accepted. If you can't be in class on February 10, take a picture of your quiz and email it to me before 9 am. Each question is worth 1 point (for a total of 10 points). Where appropriate, show sufficient work to obtain credit for your answer. Do not attach other pages (use back of quiz if necessary). Scenario 1 (Cost of Quality): Suppose you operate a group of A Prevention C Internal Failure sandwich shops. Match the statements below with the four costs of Appraisal D External Failure quality (given to the right). Note that a cost of quality may be used more than once or not at all. Scrapped Meat and Vegetables (damaged during food preparation). Incoming Inspection (of ingredients) Obsolete / expired food. Procedures for employee handwashing. Fines from Government Health Inspectors. Scenario 2 (Control Chart): A small service company is concerned about the amount of time it takes to complete a particular service. The manager has information that this particular service is creating customer dissatisfaction. The service was redesigned and a time study conducted. The manager wants to know if the process completion times are stable, so she decides to time the process completion for three employees each day (that is, subgroups of n = 3) for 10 days and use an Average and Range Chart to assess the stability of the process. The data are shown below. Subgroup Average 7.89 7.73 6.20 8.53 8.32 8.30 7.87 9.01 Subgroup Range 2.21 2.82 3.15 1.90 2.54 2.28 3.05 244 2.82 2.18 Subgroup 2 3 5 6 8 9 10 6 What is the Upper Control Limit for the Average Chart? Show your answer to two decimals. 7. What is the Lower Control Limit for the Average Chart? Show your answer to two decimals. What is the Upper Control Limit for the Range Chart? Show your answer to two decimals. 9. Plot the average and range chart. Average Chart Range Chart 10. Is the process stable (that is, in-control)? Explain
Step by Step Solution
There are 3 Steps involved in it

Get step-by-step solutions from verified subject matter experts