

Question: i . Use the following data and Excel to plot a standard addition constant volume calibration curve. Use your curve to determine the concentration (
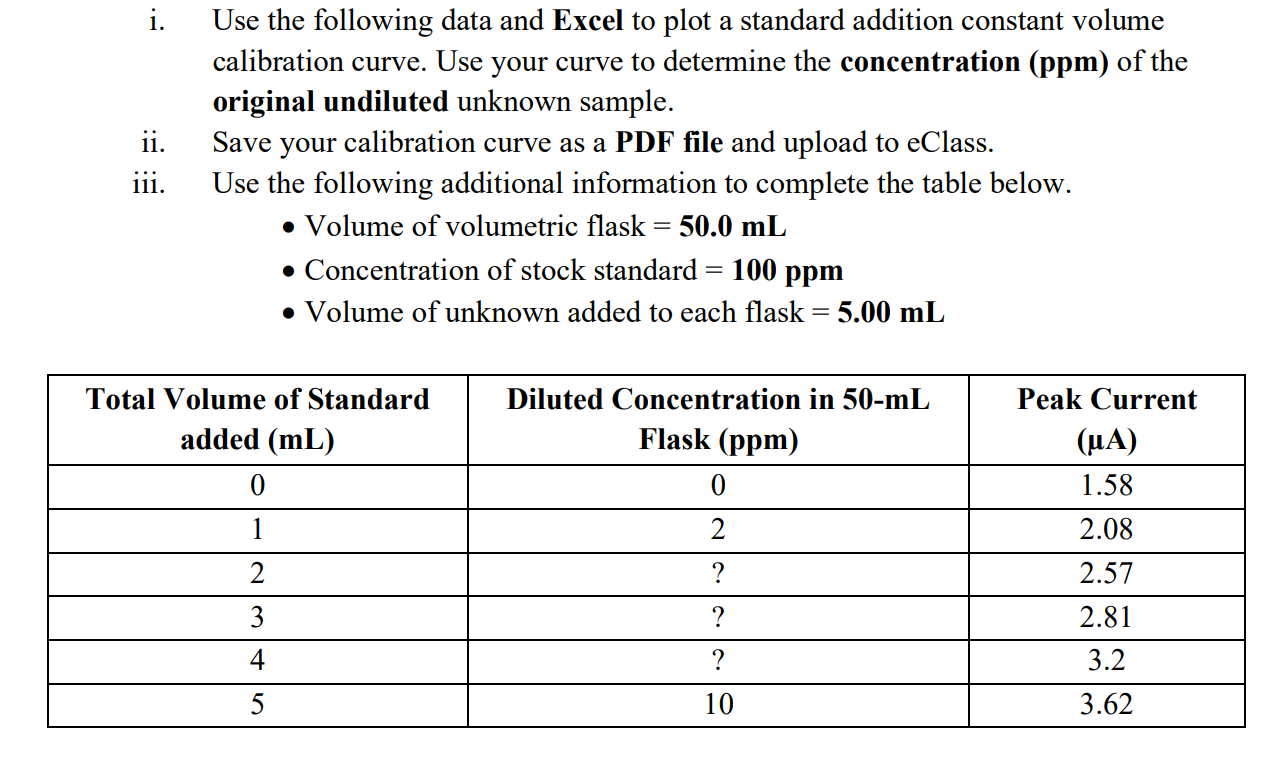
i Use the following data and Excel to plot a standard addition constant volume calibration curve. Use your curve to determine the concentration ppm of the original undiluted unknown sample.
ii Save your calibration curve as a PDF file and upload to eClass.
iii. Use the following additional information to complete the table below.
Volume of volumetric flask
Concentration of stock standard
Volume of unknown added to each flask
tabletableTotal Volume of Standardadded mLtableDiluted Concentration in mLFlask ppmtablePeak Current
Step by Step Solution
There are 3 Steps involved in it
1 Expert Approved Answer
Step: 1 Unlock

Question Has Been Solved by an Expert!
Get step-by-step solutions from verified subject matter experts
Step: 2 Unlock
Step: 3 Unlock