

Question: **in Matlab: a plot is needed instead of a table ideal gas 1.9 A storage tank contains a liquid at depth y, where y =
**in Matlab: a plot is needed instead of a table
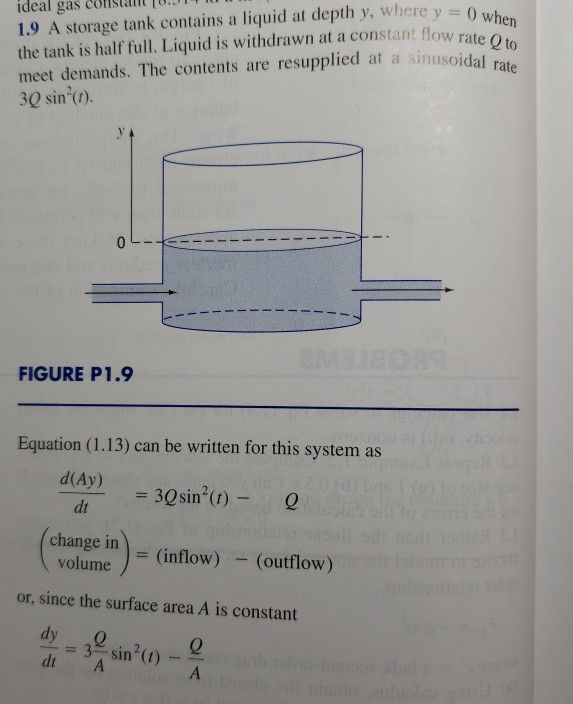
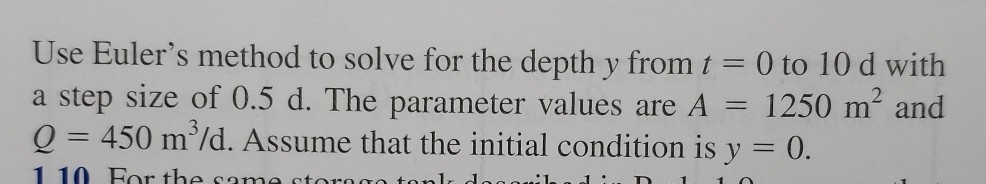
ideal gas 1.9 A storage tank contains a liquid at depth y, where y = 0 when the tank is half full. Liquid is withdrawn at a constant flow rate Q to sinusoidal rate meet demands. The contents are resupplied at a 3Q sin (r). FIGURE P1.9 Equation (1.13) can be written for this system as d(Ay) = 3Q sin (t) dt change in volume = (inflow) - (outflow) or, since the surface area A is constant dy sin (1) %3D dt whole Use Euler's method to solve for the depth y from t = 0 to 10 d with a step size of 0.5 d. The parameter values are A Q = 450 m/d. Assume that the initial condition is y = 0. 1250 m and 1 10 For the same store
Step by Step Solution
There are 3 Steps involved in it

Get step-by-step solutions from verified subject matter experts