

Question: In The US Census Bureau provides considerable demographic information that is useful for marketers. Assume that the following table provides a sample of such population
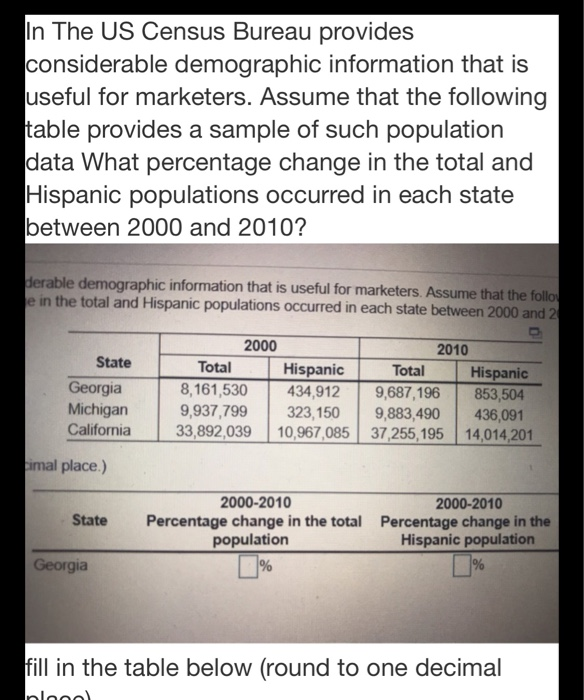
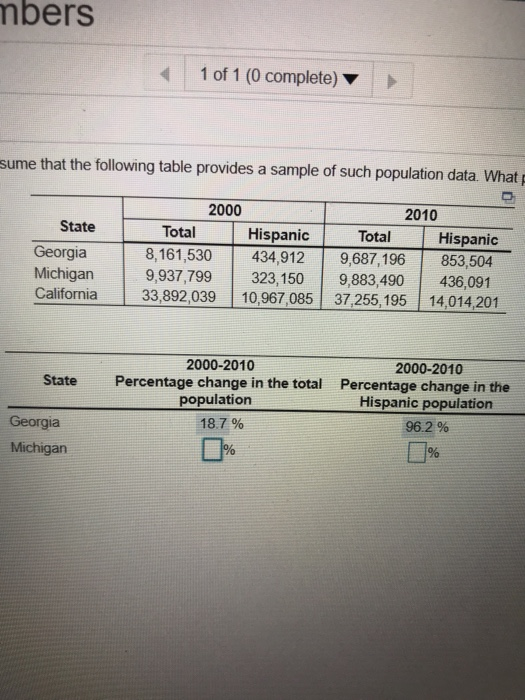
In The US Census Bureau provides considerable demographic information that is useful for marketers. Assume that the following table provides a sample of such population data What percentage change in the total and Hispanic populations occurred in each state between 2000 and 2010? derable demographic information that is useful for marketers. Assume that the follo e in the total and Hispanic populations occurred in each state between 2000 and 20 2000 2010 State Total Hispanic 434,912 Total Hispanic 853,504 436,091 14,014,201 Georgia Michigan 8,161,530 9,937,799 33,892,039 10,967,085 37,255, 195 9,687,196 323, 150 9,883,490 California imal place.) 2000-2010 2000-2010 Percentage change in the Hispanic population % State Percentage change in the total population Georgia % fill in the table below (round to one decimal nlono) mbers 1 of 1 (0 complete) sume that the following table provides a sample of such population data. What p 2000 2010 State Total Hispanic Total Hispanic 853,504 Georgia Michigan California 8,161,530 9,937,799 33,892,039 434,912 9,687,196 323,150 9,883,490 436,091 14,014,201 10,967,085 37,255, 195 2000-2010 Percentage change in the total population 2000-2010 Percentage change in the Hispanic population State Georgia 18.7% 96.2 % Michigan %
Step by Step Solution
There are 3 Steps involved in it

Get step-by-step solutions from verified subject matter experts