

Question: The U.S. Census Bureau provides considerable demographic information that is useful for marketers. Assume that the following table provides a sample of such population data.
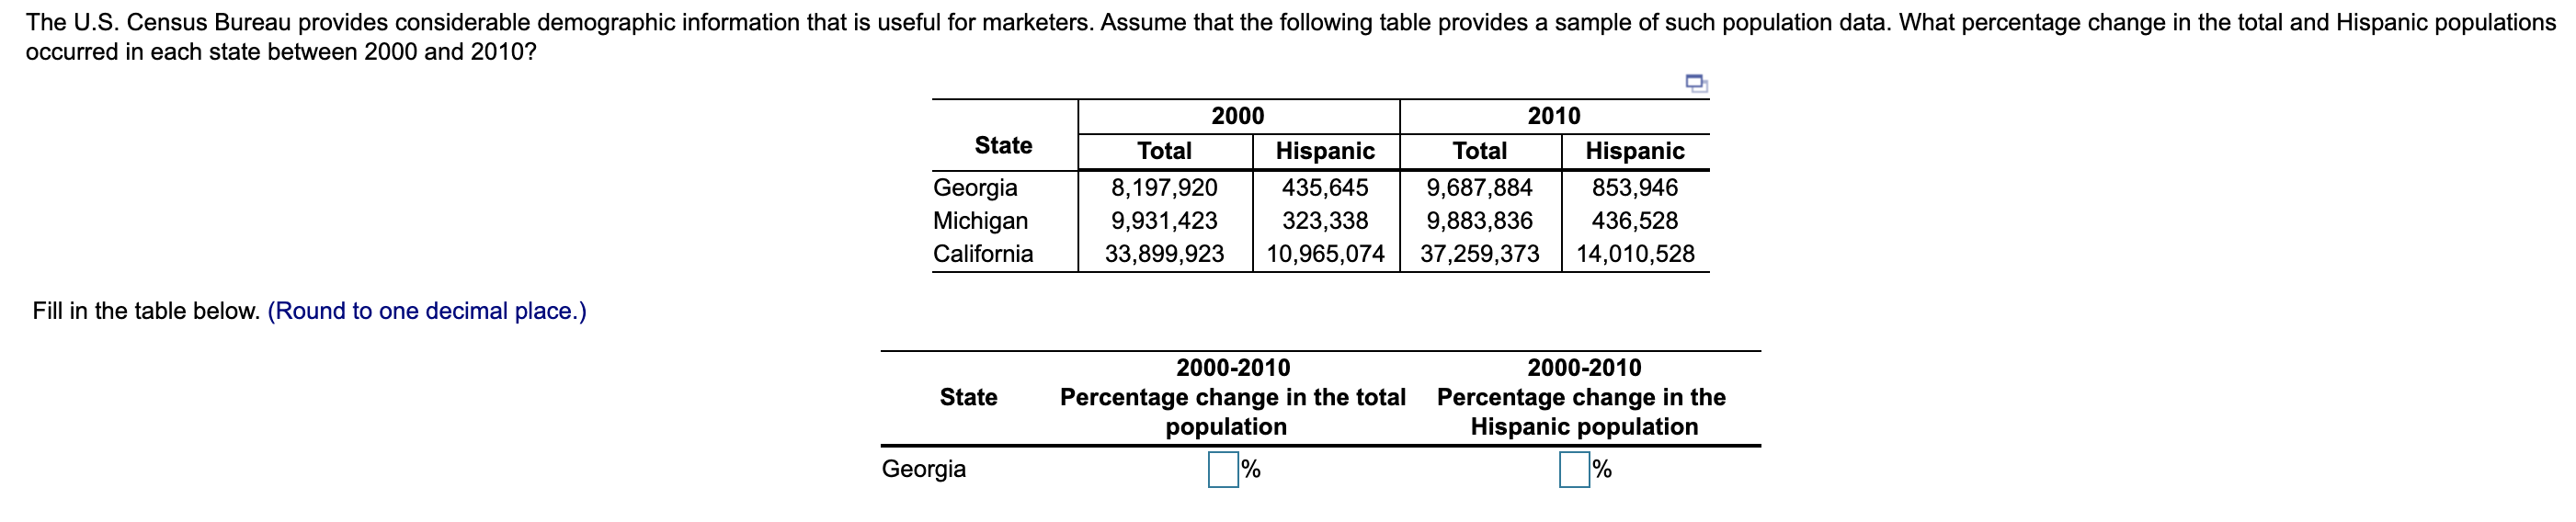
The U.S. Census Bureau provides considerable demographic information that is useful for marketers. Assume that the following table provides a sample of such population data. What percentage change in the total and Hispanic populations occurred in each state between 2000 and 2010? State Georgia Michigan California 2000 Total Hispanic 8,197,920 435,645 9,931,423 323,338 33,899,923 10,965,074 2010 Total Hispanic 9,687,884 853,946 9,883,836 436,528 37,259,373 14,010,528 Fill in the table below. (Round to one decimal place.) State 2000-2010 Percentage change in the total population 2000-2010 Percentage change in the Hispanic population Georgia %
Step by Step Solution
There are 3 Steps involved in it

Get step-by-step solutions from verified subject matter experts