

Question: The U.S. Census Bureau provides considerable demographic information that is useful for marketers. Assume that the following table provides a sample of such population data.
The U.S. Census Bureau provides considerable demographic information that is useful for marketers. Assume that the following table provides a sample of such population data. What percentage change in the total and Hispanic populations occurred in each state between Year A and Year B? State State X State Y State Z State State X to Year A Total Hispanic 8,100,162 434,204 9,939,560 323,564 33,880,165 10,962,746 Year B Fill in the table below. (Round to one decimal place.) Year A Year B Year A Year B Percentage change in the total Percentage change in the population Hispanic population % 7 Total Hispanic 9,687,692 853,373 9,883,962 436,958 37,250,077 14,019,554 %
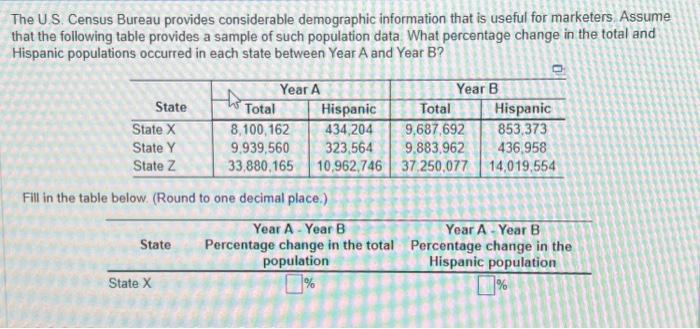
The U.S. Census Bureau provides considerable demographic information that is useful for marketers. Assume that the following table provides a sample of such population data. What percentage change in the total and Hispanic populations occurred in each state between Year A and Year B? Fill in the table below. (Round to one decimal place.)
Step by Step Solution
There are 3 Steps involved in it
1 Expert Approved Answer
Step: 1 Unlock

Question Has Been Solved by an Expert!
Get step-by-step solutions from verified subject matter experts
Step: 2 Unlock
Step: 3 Unlock