

Question: Instructions: 1. Solve these problems using Microsoft Excel. 2. The final excel files must be uploaded to the blackboard (assignment section) before the deadline. 3.
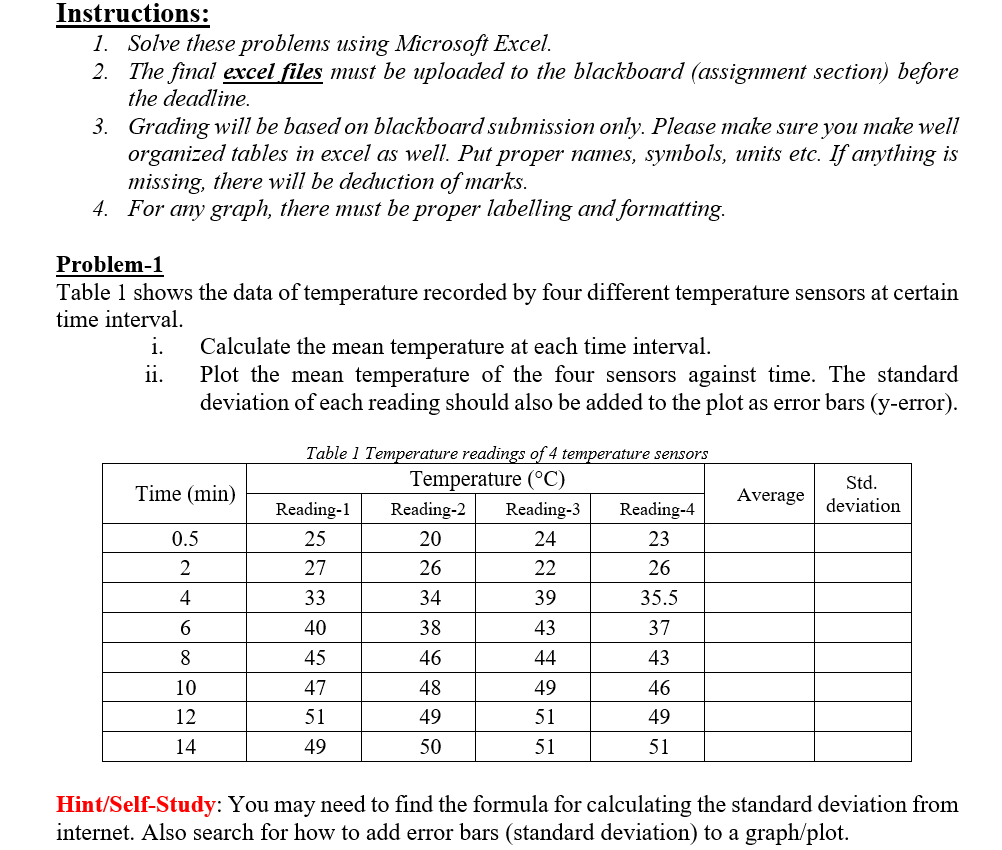
Instructions: 1. Solve these problems using Microsoft Excel. 2. The final excel files must be uploaded to the blackboard (assignment section) before the deadline. 3. Grading will be based on blackboard submission only. Please make sure you make well organized tables in excel as well. Put proper names, symbols, units etc. If anything is missing, there will be deduction of marks. 4. For any graph, there must be proper labelling and formatting. Problem-1 Table 1 shows the data of temperature recorded by four different temperature sensors at certain time interval. i. Calculate the mean temperature at each time interval. ii. Plot the mean temperature of the four sensors against time. The standard deviation of each reading should also be added to the plot as error bars (y-error). Time (min) Average Std. deviation 0.5 2 4 Table 1 Temperature readings of 4 temperature sensors Temperature (C) Reading-1 Reading-2 Reading-3 Reading-4 25 20 24 23 27 26 22 26 33 34 39 35.5 40 38 43 37 45 46 44 43 47 48 49 46 51 49 51 49 49 50 51 51 6 8 10 12 14 Hint/Self-Study: You may need to find the formula for calculating the standard deviation from internet. Also search for how to add error bars (standard deviation) to a graph/plot
Step by Step Solution
There are 3 Steps involved in it

Get step-by-step solutions from verified subject matter experts