

Question: Interpret the graph for Activity 2. Is there an optimum temperature for catalase that makes it the most productive in terms of reaction rate? At
Interpret the graph for Activity 2. Is there an optimum temperature for catalase that makes it the most productive in terms of reaction rate? At what temperature does the rate decrease? Explain why.
I included the data table, but the graph is what you need to answer the questions
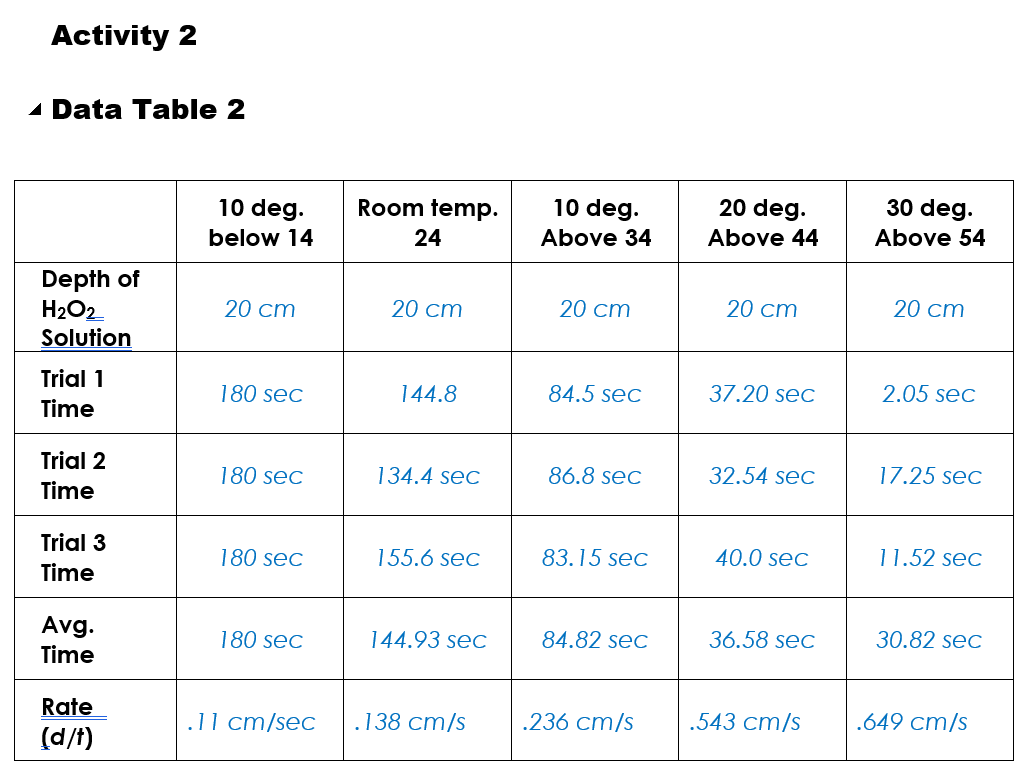
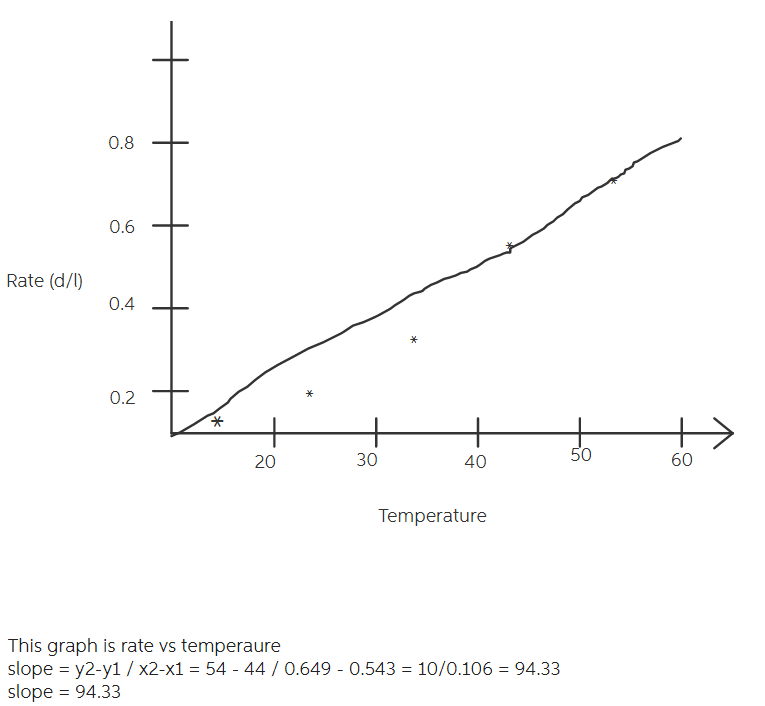
Data Table 2 This graph is rate vs temperaure slope=y2y1/x2x1=5444/0.6490.543=10/0.106=94.33slope=94.33
Step by Step Solution
There are 3 Steps involved in it
1 Expert Approved Answer
Step: 1 Unlock

Question Has Been Solved by an Expert!
Get step-by-step solutions from verified subject matter experts
Step: 2 Unlock
Step: 3 Unlock