

Question: Is there a constant or trend pattern or seasonality for this graph? MONTHLY SALES CHART FOR DIESEL F Demand 620000 600000 580000 560000 540000 520000
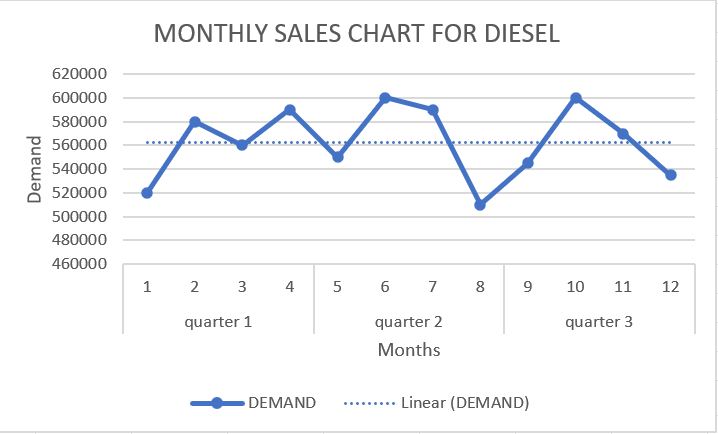
Is there a constant or trend pattern or seasonality for this graph?
MONTHLY SALES CHART FOR DIESEL F Demand 620000 600000 580000 560000 540000 520000 500000 480000 460000 1 2 3 4 4 5 6 7 8 8 9 10 11 12 quarter 1 quarter 3 quarter 2 Months DEMAND Linear (DEMAND)Step by Step Solution
There are 3 Steps involved in it
1 Expert Approved Answer
Step: 1 Unlock

Question Has Been Solved by an Expert!
Get step-by-step solutions from verified subject matter experts
Step: 2 Unlock
Step: 3 Unlock