

Question: K The U.S. Census Bureau provides considerable demographic information that is useful for marketers. Assume that the following table provides a sample of such
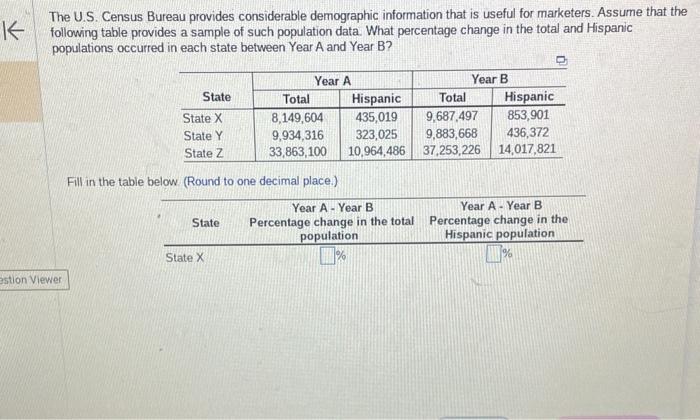
K The U.S. Census Bureau provides considerable demographic information that is useful for marketers. Assume that the following table provides a sample of such population data. What percentage change in the total and Hispanic populations occurred in each state between Year A and Year B? Year A Year B State Total Hispanic Total Hispanic State X 8,149,604 435,019 9,687,497 853,901 State Y State Z 9,934,316 33,863,100 323,025 10,964,486 9,883,668 436,372 37,253,226 14,017,821 Fill in the table below (Round to one decimal place.) State Year A Year B Percentage change in the total population Year A Year B Percentage change in the Hispanic population State X estion Viewer % %
Step by Step Solution
There are 3 Steps involved in it

Get step-by-step solutions from verified subject matter experts