

Question: # LE 1 - Problem 2 Guideline doc for students import numpy as np import matplotlib.pyplot as plt from sklearn.linear_model import LinearRegression # Raw Data
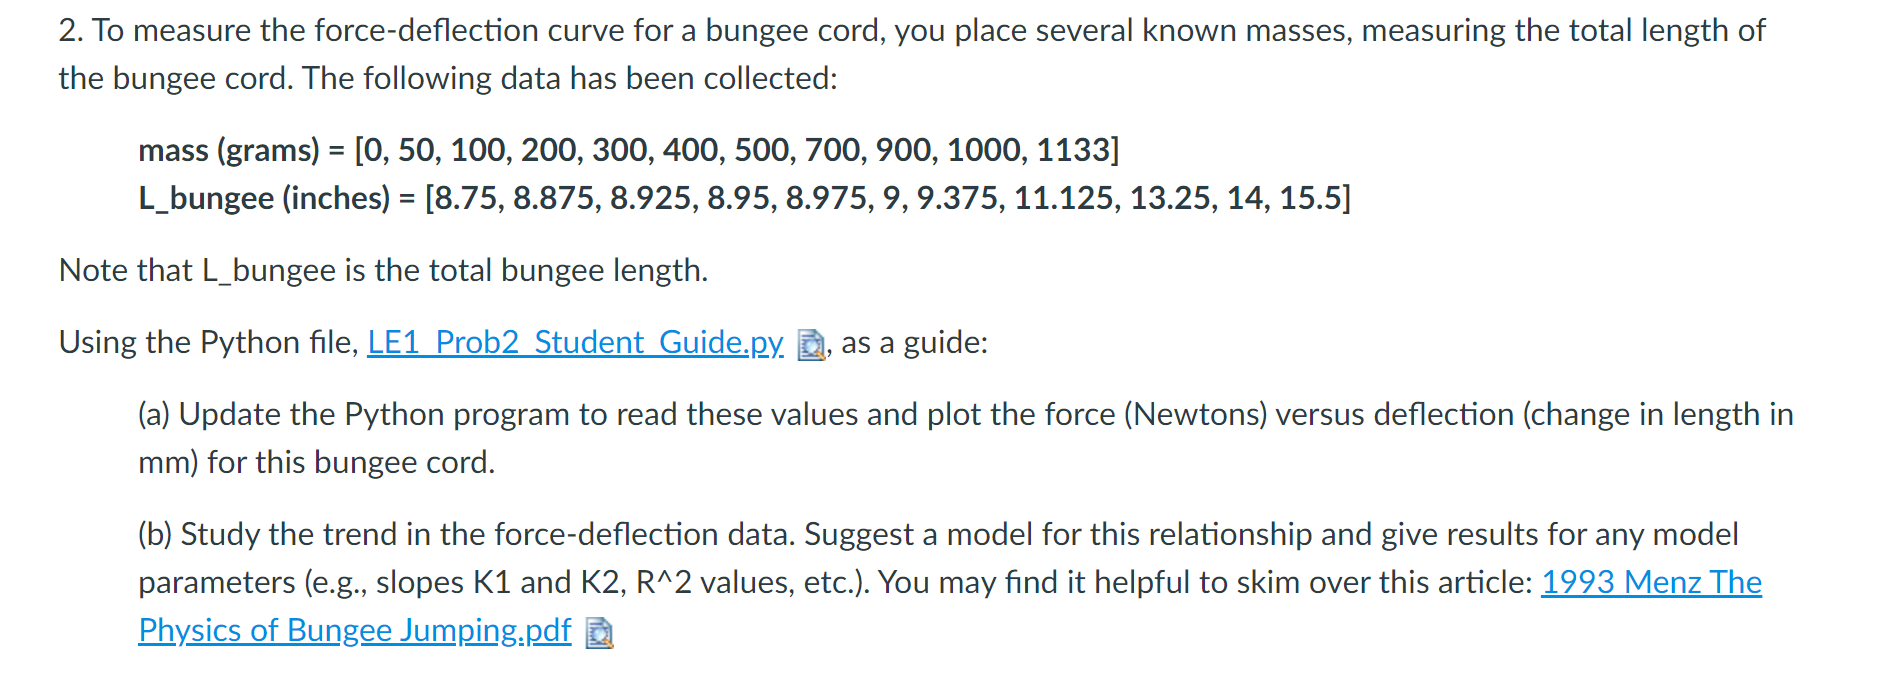
# LE 1 - Problem 2 Guideline doc for students import numpy as np import matplotlib.pyplot as plt from sklearn.linear_model import LinearRegression # Raw Data arrays (do not adjust) Mass = np.array([0,50,100,200,300,400,500,700,900,1000,1133]).reshape(-1, 1) # [g] L_bungee = np.array([8.75,8.875,8.925,8.95,8.975,9,9.375,11.125,13.25,14,15.5]).reshape(-1, 1) #[in] #------------------------------------------------------------------------------------------------------- # Begin code updates here # All code required can be found in the Lab1_Python_Basics.py file from Lab Work #------------------------------------------------------------------------------------------------------- # Convert bungee data from [in] to [mm] L_mm = # Solve for Force --> convert mass from [g] to [kg] and multiply by gravity, 9.81 [m/s^2] Force = # Solve for Delta Length by subtracting equilibrium length from all L_mm values DeltaL = # Plot data to see where change in K1 and K2 occurs plt.figure() plt.scatter(DeltaL,Force) plt.xlabel('Length [mm]') plt.ylabel('Force [N]') plt.title('Force vs Length') plt.grid() plt.show() # Looking at plot, it seems the K1 to K2 change occurs at the ___ data point # Set this equal to the value at which K1 & K2 change its = # Separate K1 and K2 data sets X_k1, Y_k1 = DeltaL[0:its], Force[0:its] X_k2, Y_k2 = DeltaL[its-1:], Force[its-1:] # its-1 allows for some overlap # Apply linear regression to K1 Subset # Linear Regression: For K1, use X_k1 and Y_k1 data (data does not require reshaping) # Solve for slope_k1, int_k1, and Rs_k1 (Rs is the R^2 value) print('k1 intercept [N] =', int_k1) print('k1 slope [N/m] =', slope_k1) print('k1 R^2 =', Rs_k1) # Apply linear regression to K2 Subset # Linear Regression: For K2, use X_k2 and Y_k2 data (data does not require reshaping) # Solve for slope_k2, int_k2, and Rs_k2 (Rs is the R^2 value) print('k2 intercept [N] =', int_k2) print('k2 slope [N/m] =', slope_k2) print('k2 R^2 =', Rs_k2) #------------------------------------------------------------------------------------------------------- # End of code updates #------------------------------------------------------------------------------------------------------- # Plot the raw data and regression using a scatter plot # Plot does not need updating plt.figure() plt.scatter(DeltaL,Force, c="r", marker='x') plt.plot(X_k1,slope_k1*X_k1 + int_k1) plt.plot(X_k2,slope_k2*X_k2 + int_k2) plt.xlabel('Length [mm]') plt.ylabel('Force [N]') plt.legend(['K1 Reg.','K2 Reg.','Raw Data']) plt.title('Regressions of Bungee Data') plt.grid() plt.show()2. To measure the force-deflection curve for a bungee cord, you place several known masses, measuring the total length of the bungee cord. The following data has been collected: mass (grams) = [0, 50, 100, 200, 300, 400, 500, 700, 900, 1000, 1133] L_bungee (inches) = [8.75, 8.875, 8.925, 8.95, 8.975, 9,9.375, 11.125, 13.25, 14, 15.5] Note that L_bungee is the total bungee length. Using the Python file, LE1 Prob2 Student Guide.py. as a guide: (a) Update the Python program to read these values and plot the force (Newtons) versus deflection (change in length in mm) for this bungee cord. (b) Study the trend in the force-deflection data. Suggest a model for this relationship and give results for any model parameters (e.g., slopes K1 and K2, R^2 values, etc.). You may find it helpful to skim over this article: 1993 Menz The Physics of Bungee Jumping.pdf 2. To measure the force-deflection curve for a bungee cord, you place several known masses, measuring the total length of the bungee cord. The following data has been collected: mass (grams) = [0, 50, 100, 200, 300, 400, 500, 700, 900, 1000, 1133] L_bungee (inches) = [8.75, 8.875, 8.925, 8.95, 8.975, 9,9.375, 11.125, 13.25, 14, 15.5] Note that L_bungee is the total bungee length. Using the Python file, LE1 Prob2 Student Guide.py. as a guide: (a) Update the Python program to read these values and plot the force (Newtons) versus deflection (change in length in mm) for this bungee cord. (b) Study the trend in the force-deflection data. Suggest a model for this relationship and give results for any model parameters (e.g., slopes K1 and K2, R^2 values, etc.). You may find it helpful to skim over this article: 1993 Menz The Physics of Bungee Jumping.pdf
Step by Step Solution
There are 3 Steps involved in it

Get step-by-step solutions from verified subject matter experts