

Question: Make an X Bar Chart to see if the process is in control Sample mean .1009 Control limits LCL: .1005 UCL: .1011 Item # 1
Make an X Bar Chart to see if the process is in control
Sample mean .1009
Control limits
LCL: .1005
UCL: .1011
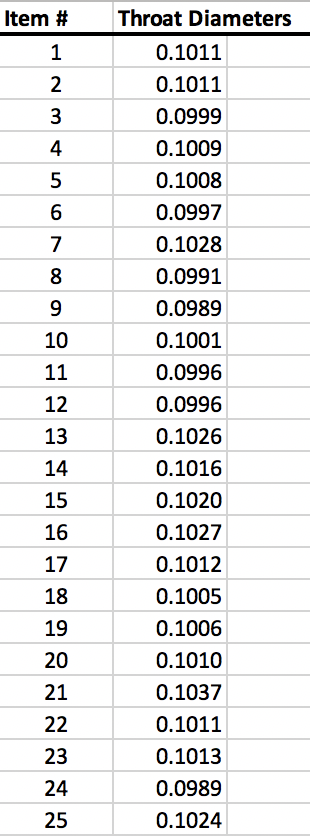
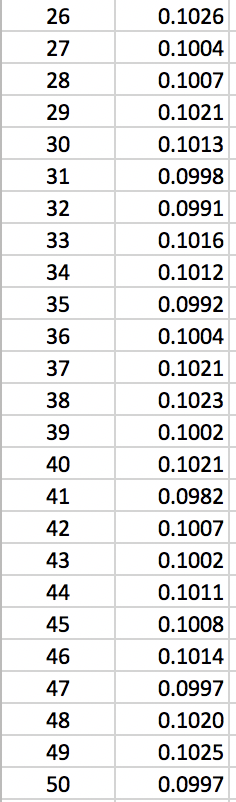
Item # 1 2 3 4 5 6 7 8 9 10 11 12 13 Throat Diameters 0.1011 0.1011 0.0999 0.1009 0.1008 0.0997 0.1028 0.0991 0.0989 0.1001 0.0996 0.0996 0.1026 0.1016 0.1020 0.1027 0.1012 0.1005 0.1006 0.1010 0.1037 0.1011 0.1013 0.0989 0.1024 14 15 16 17 18 19 20 21 22 23 24 25 26 27 28 29 30 31 32 33 34 35 36 37 0.1026 0.1004 0.1007 0.1021 0.1013 0.0998 0.0991 0.1016 0.1012 0.0992 0.1004 0.1021 0.1023 0.1002 0.1021 0.0982 0.1007 0.1002 0.1011 0.1008 0.1014 0.0997 0.1020 0.1025 38 39 40 41 42 43 44 45 46 47 48 49 50 0.0997
Step by Step Solution
There are 3 Steps involved in it
1 Expert Approved Answer
Step: 1 Unlock

Question Has Been Solved by an Expert!
Get step-by-step solutions from verified subject matter experts
Step: 2 Unlock
Step: 3 Unlock