

Question: Make the graph and post that too. Data showing the number of errors per one hundred lines of code for a software development project are


Make the graph and post that too.
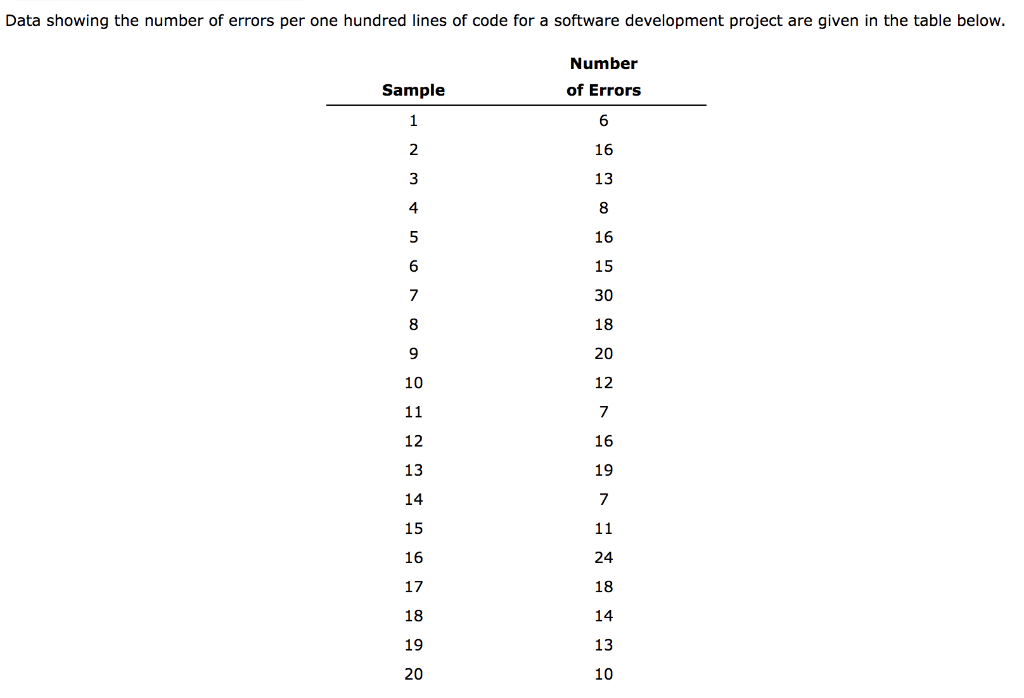
Data showing the number of errors per one hundred lines of code for a software development project are given in the table below. Sample 1 2 3 4 5 6 7 8 9 10 11 12 13 14 15 16 17 18 19 20 Number of Errors 6 16 13 8 16 15 30 18 20 12 7 16 19 7 11 24 18 14 13 10 What is the average number of errors per 1,000 lines of code? Do not round intermediate calculations. Round your answer to three decimal places. Compute the control limits for a c-chart. Do not round intermediate calculations. Round your answers to three decimal places. UCLC: LCLc: Choose the correct graph for the c-chart. Does the process appear to be in statistical control? The process -Select- in statistical controlStep by Step Solution
There are 3 Steps involved in it
1 Expert Approved Answer
Step: 1 Unlock

Question Has Been Solved by an Expert!
Get step-by-step solutions from verified subject matter experts
Step: 2 Unlock
Step: 3 Unlock