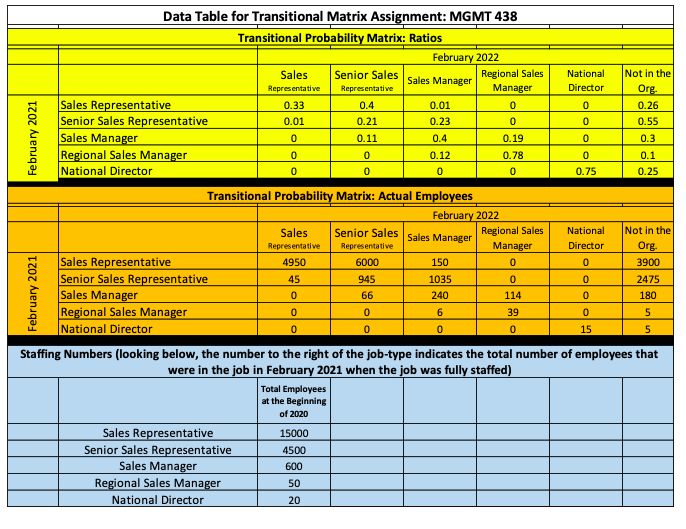
Question: National Director Data Table for Transitional Matrix Assignment: MGMT 438 Transitional Probability Matrix: Ratios February 2022 Sales Senior Sales Sales Manager Regional Sales Representative Representative

National Director Data Table for TransitionalNational Director Data Table for Transitional

National Director Data Table for Transitional Matrix Assignment: MGMT 438 Transitional Probability Matrix: Ratios February 2022 Sales Senior Sales Sales Manager Regional Sales Representative Representative Manager Sales Representative 0.33 0.4 0.01 0 Senior Sales Representative 0.01 0.21 0.23 0 Sales Manager 0 0.11 0.4 0.19 Regional Sales Manager 0 0 0.12 0.78 National Director 0 0 0 0 0 Not in the Org. 0.26 0.55 0.3 0 February 2021 0 0 0.75 0.1 0.25 National Director 0 Transitional Probability Matrix: Actual Employees February 2022 Sales Senior Sales Sales Manager Regional Sales Representative Representative Manager Sales Representative 4950 6000 150 0 Senior Sales Representative 45 945 1035 0 Sales Manager 0 66 240 114 Regional Sales Manager 0 0 6 39 National Director 0 0 0 0 February 2021 Not in the Org 3900 2475 180 5 0 0 0 15 5 Staffing Numbers (looking below, the number to the right of the job-type indicates the total number of employees that were in the job in February 2021 when the job was fully staffed) Total Employees at the Beginning of 2020 Sales Representative Senior Sales Representative Sales Manager Regional Sales Manager National Director 15000 4500 600 50 20 The CEO of the company has come to your office and posed a question for you to consider. The CEO articulated the following to you: "I am trying to determine what to do to increase our medium-term profitability and effectiveness as an organization over the next 3 years. I am considering three options: (a) Reduce our number of employees by 20%. (b) Increase our training and development budget by 20%. (c) Add a line-item to our budget to enable us to provide salary retention bonuses of up to 20% each year to our most valued employees." The CEO has given you a day to come up with a recommendation of which of the three options to recommend. In addition to making your choice, provide a paragraph of convincing evidence for why you recommend what you recommend. Of course, you do not have all the data you would like, including what it costs to replace employees who turnover. Thus, use the limited information you have in order to make the best recommendation possible. Please note that the CEO is a data-driven individual who is motivated by numbers, so be sure to use data in your response to the CEO

Step by Step Solution

There are 3 Steps involved in it

1 Expert Approved Answer
Step: 1 Unlock blur-text-image
Question Has Been Solved by an Expert!

Get step-by-step solutions from verified subject matter experts

Step: 2 Unlock
Step: 3 Unlock

Students Have Also Explored These Related General Management Questions!