

Question: Need help, i don't understand what to do here. Try It E 2.9 The following data represent the number of employees at various restaurants in
Need help, i don't understand what to do here.
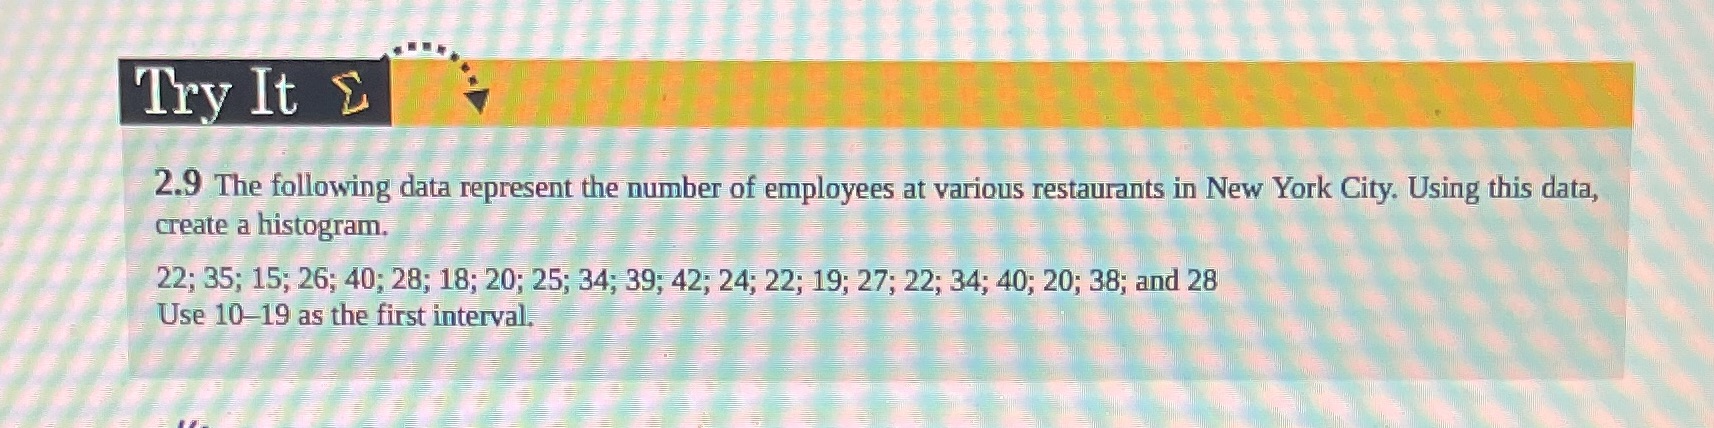
Try It E 2.9 The following data represent the number of employees at various restaurants in New York City. Using this data, create a histogram. 22; 35; 15; 26; 40; 28; 18; 20; 25; 34; 39; 42; 24; 22; 19; 27; 22; 34; 40; 20; 38; and 28 Use 10-19 as the first interval
Step by Step Solution
There are 3 Steps involved in it
1 Expert Approved Answer
Step: 1 Unlock

Question Has Been Solved by an Expert!
Get step-by-step solutions from verified subject matter experts
Step: 2 Unlock
Step: 3 Unlock