

Question: need help with B Consider the following time series data. t 1 1 2 2 3 3 4 5 y 5 12 10 13 14
need help with B 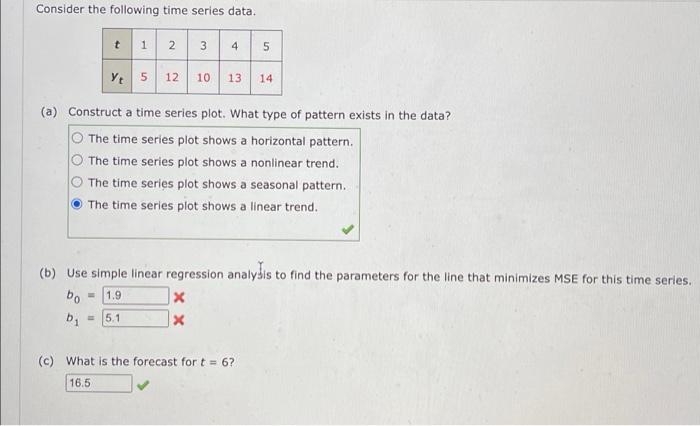
Consider the following time series data. t 1 1 2 2 3 3 4 5 y 5 12 10 13 14 (a) Construct a time series plot. What type of pattern exists in the data? The time series plot shows a horizontal pattern. The time series plot shows a nonlinear trend. The time series plot shows a seasonal pattern. The time series plot shows a linear trend. (b) Use simple linear regression analyJis to find the parameters for the line that minimizes MSE for this time series. bo X by = 5.1 1.9 (c) What is the forecast for t = 6? 16.5
Step by Step Solution
There are 3 Steps involved in it
1 Expert Approved Answer
Step: 1 Unlock

Question Has Been Solved by an Expert!
Get step-by-step solutions from verified subject matter experts
Step: 2 Unlock
Step: 3 Unlock