

Question: Not looking for the answer to question A. Chapter 09 Homework: Forecasting and Demand Planning 3. template to answer the following questions. a. Plot the
Not looking for the answer to question A.
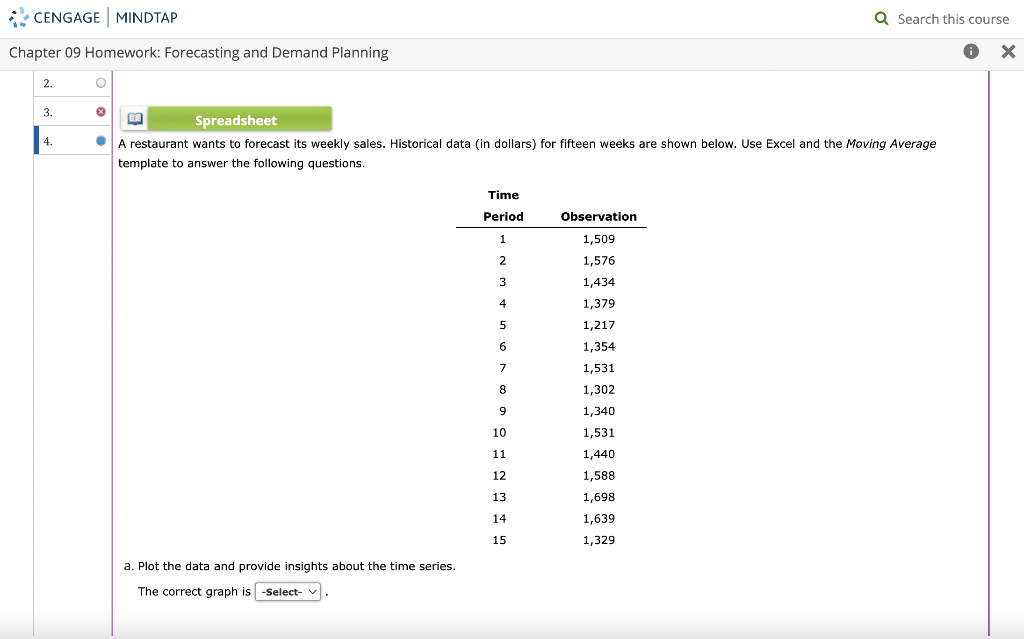
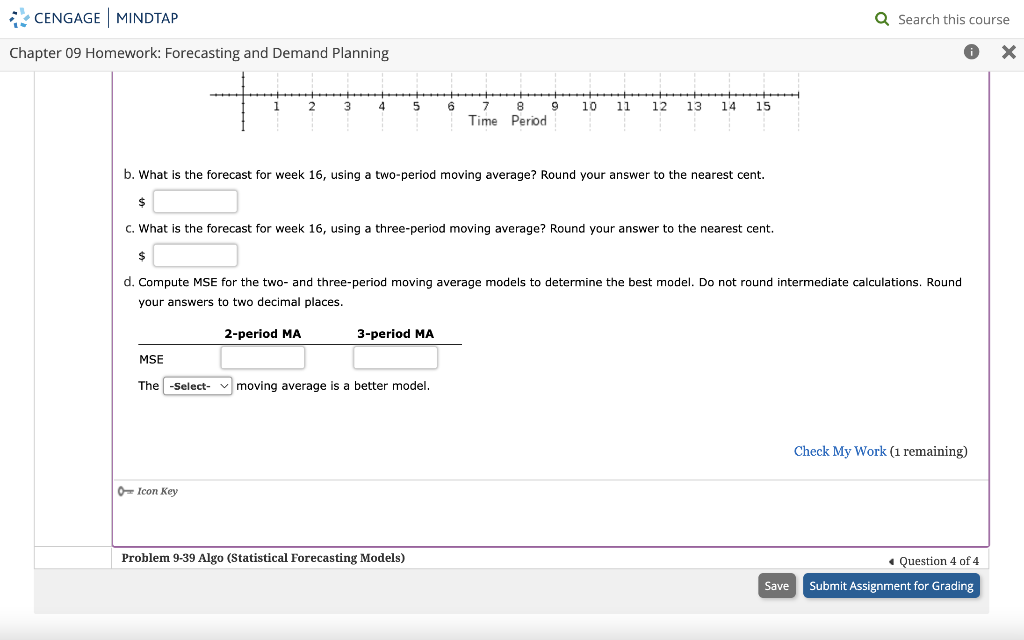
Chapter 09 Homework: Forecasting and Demand Planning 3. template to answer the following questions. a. Plot the data and provide insights about the time seric.. The correct graph is Chapter 09 Homework: Forecasting and Demand Planning b. What is the forecast for week 16 , using a two-period moving average? Round your answer to the nearest cent. $ c. What is the forecast for week 16 , using a three-period moving average? Round your answer to the nearest cent. d. Compute MSE for the two- and three-period moving average models to determine the best model. Do not round intermediate calculations. Round your answers to two decimal places. The moving average is a better model. Check My Work (1 remaining) 0= Icon Key Problem 9-39 Algo (Statistical Forecasting Models) Question 4 of 4
Step by Step Solution
There are 3 Steps involved in it

Get step-by-step solutions from verified subject matter experts