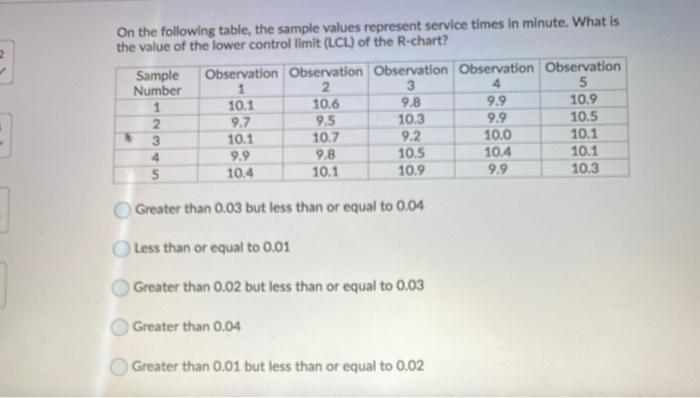
Question: On the following table, the sample values represent service times in minute. What is the value of the lower controllimit (LCL) of the R-chart? Sample

On the following table, the sample values
On the following table, the sample values represent service times in minute. What is the value of the lower controllimit (LCL) of the R-chart? Sample Number 2 3 4 5 Observation Observation Observation Observation Observation 1 2 3 4 5 10.1 10.6 9.8 9.9 10.9 9.7 9.5 10.3 9.9 10.5 10.1 10.7 9.2 10.0 10.1 9.9 9.8 10.5 10.4 10.1 10.4 10.1 10.9 9.9 10.3 Greater than 0.03 but less than or equal to 0.04 Less than or equal to 0.01 Greater than 0.02 but less than or equal to 0.03 Greater than 0.04 Greater than 0.01 but less than or equal to 0.02

Step by Step Solution

There are 3 Steps involved in it

1 Expert Approved Answer
Step: 1 Unlock blur-text-image
Question Has Been Solved by an Expert!

Get step-by-step solutions from verified subject matter experts

Step: 2 Unlock
Step: 3 Unlock

Students Have Also Explored These Related General Management Questions!