

Question: Operation Management : Greetings... DO NOT RESPOND TO MY QUESTION UNTIL YOU UNDERSTAND WHAT MIPO - MITE FORMAT IS AND HOW TO RESPOND
Operation Management :
Greetings... DO NOT RESPOND TO MY QUESTION UNTIL YOU UNDERSTAND WHAT " MIPO - MITE FORMAT " IS AND HOW TO RESPOND IN IT; IF YOU DO, YOUR QUESTION WILL BE DOWNVOTED .
Please respond as soon as possible... Only in The " MIPO - MITE Format," that is, OO IKKNT... Step-by-Step Solution...
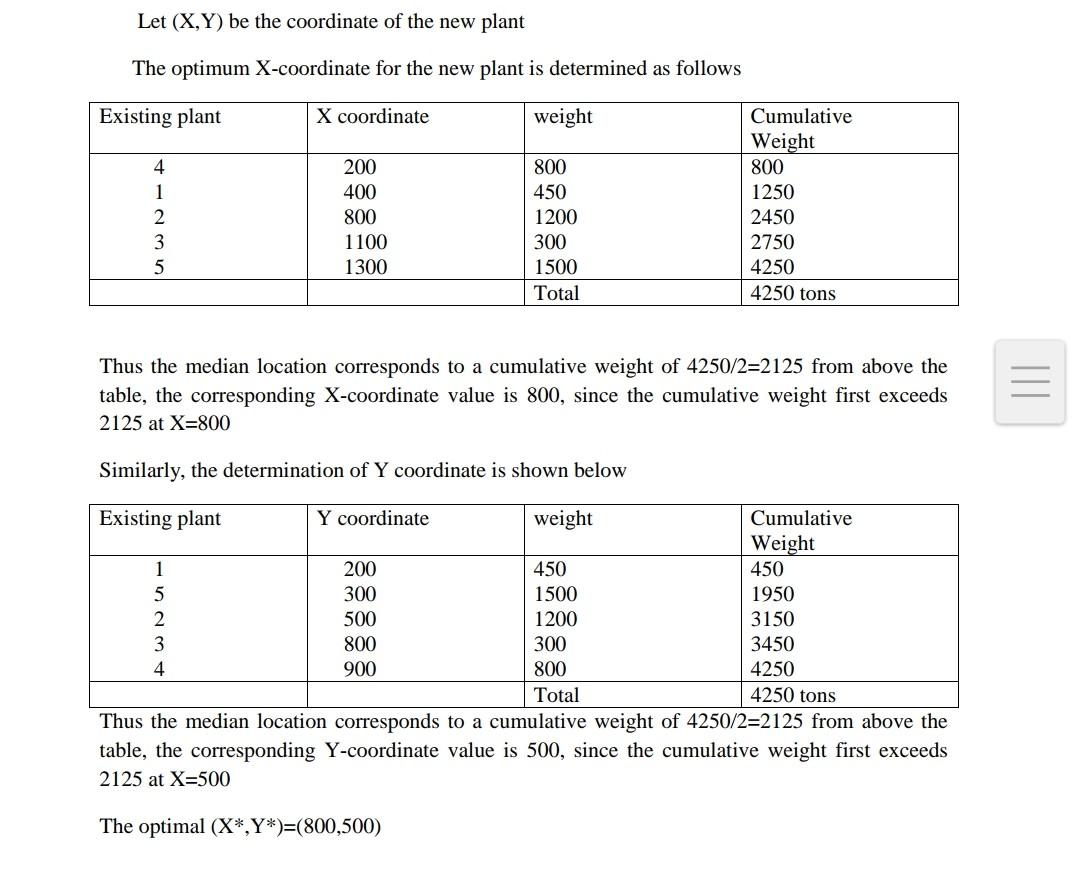
Let (X,Y) be the coordinate of the new plant The optimum X-coordinate for the new plant is determined as follows Existing plant X coordinate weight 200 400 4 1 2 3 5 Cumulative Weight 800 1250 2450 2750 4250 4250 tons 800 450 1200 300 1500 Total 800 1100 1300 Thus the median location corresponds to a cumulative weight of 4250/2=2125 from above the table, the corresponding X-coordinate value is 800, since the cumulative weight first exceeds 2125 at X=800 Similarly, the determination of Y coordinate is shown below Existing plant Y coordinate weight Cumulative Weight 1 200 450 450 5 300 1500 1950 2 500 1200 3150 3 800 300 3450 4 900 800 4250 Total 4250 tons Thus the median location corresponds to a cumulative weight of 4250/2=2125 from above the table, the corresponding Y-coordinate value is 500, since the cumulative weight first exceeds 2125 at X=500 The optimal (X*,Y*)=(800,500) Coefficient of Determination, r 2 or R2 : The coefficient of determination, r", is useful because it gives the proportion of the variance (fluctuation) of one variable that is predictable from the other variable. It is a measure that allows us to determine how certain one can be in making predictions from a certain model/graph. The coefficient of determination is the ratio of the explained variation to the total variation. The coefficient of determination is such that 0 5 ras1, and denotes the strength of the linear association between x and y. The coefficient of determination represents the percent of the data that is the closest to the line of best fit. For example, if r = 0.922, then r 2 = 0.850, which means that 85% of the total variation in y can be explained by the linear relationship between x and y (as described by the regression equation). The other 15% of the total variation in y remains unexplained. The coefficient of determination is a measure of how well the regression line represents the data. If the regression line passes exactly through every point on the scatter plot, it would be able to explain all of the variation. The further the line is away from the points, the less it is able to explain. C. Qualitative or judgmental methods Delphi Method Market Research . . Delphi Method The Delphi method is a process of gaining consensus from a group of experts While maintaining their anonymity. It is forecasting techniques applied to subjective nature demand values. It is useful when there is no historical data from which to develop statistical models and when managers inside the firm have no experience. Several knowledgeable persons are asked to provide estimates of demand or forecasts of possible advances of technology. A coordinator sends questions to each member of the panel of outside experts, and they are unknown to each other. Anonymity is important when some members of the tend to dominate discussion or command a high degree of respect in their field. The members tend to respond to the questions and support their responses freely. The coordinator prepares a statistical summary of the responses along with a summary of arguments for a particular response. If the variation 7. Explain with an example how you can use the right to seek redressal
Step by Step Solution
There are 3 Steps involved in it
1 Expert Approved Answer
Step: 1 Unlock

Question Has Been Solved by an Expert!
Get step-by-step solutions from verified subject matter experts
Step: 2 Unlock
Step: 3 Unlock