

Question: PAD 1 2 1 PROBLEM SET 2 : Excel Functions and Descriptive Data Analysis ? 1 This exercise is a follow - up to Module
PAD PROBLEM SET :
Excel Functions and Descriptive Data Analysis
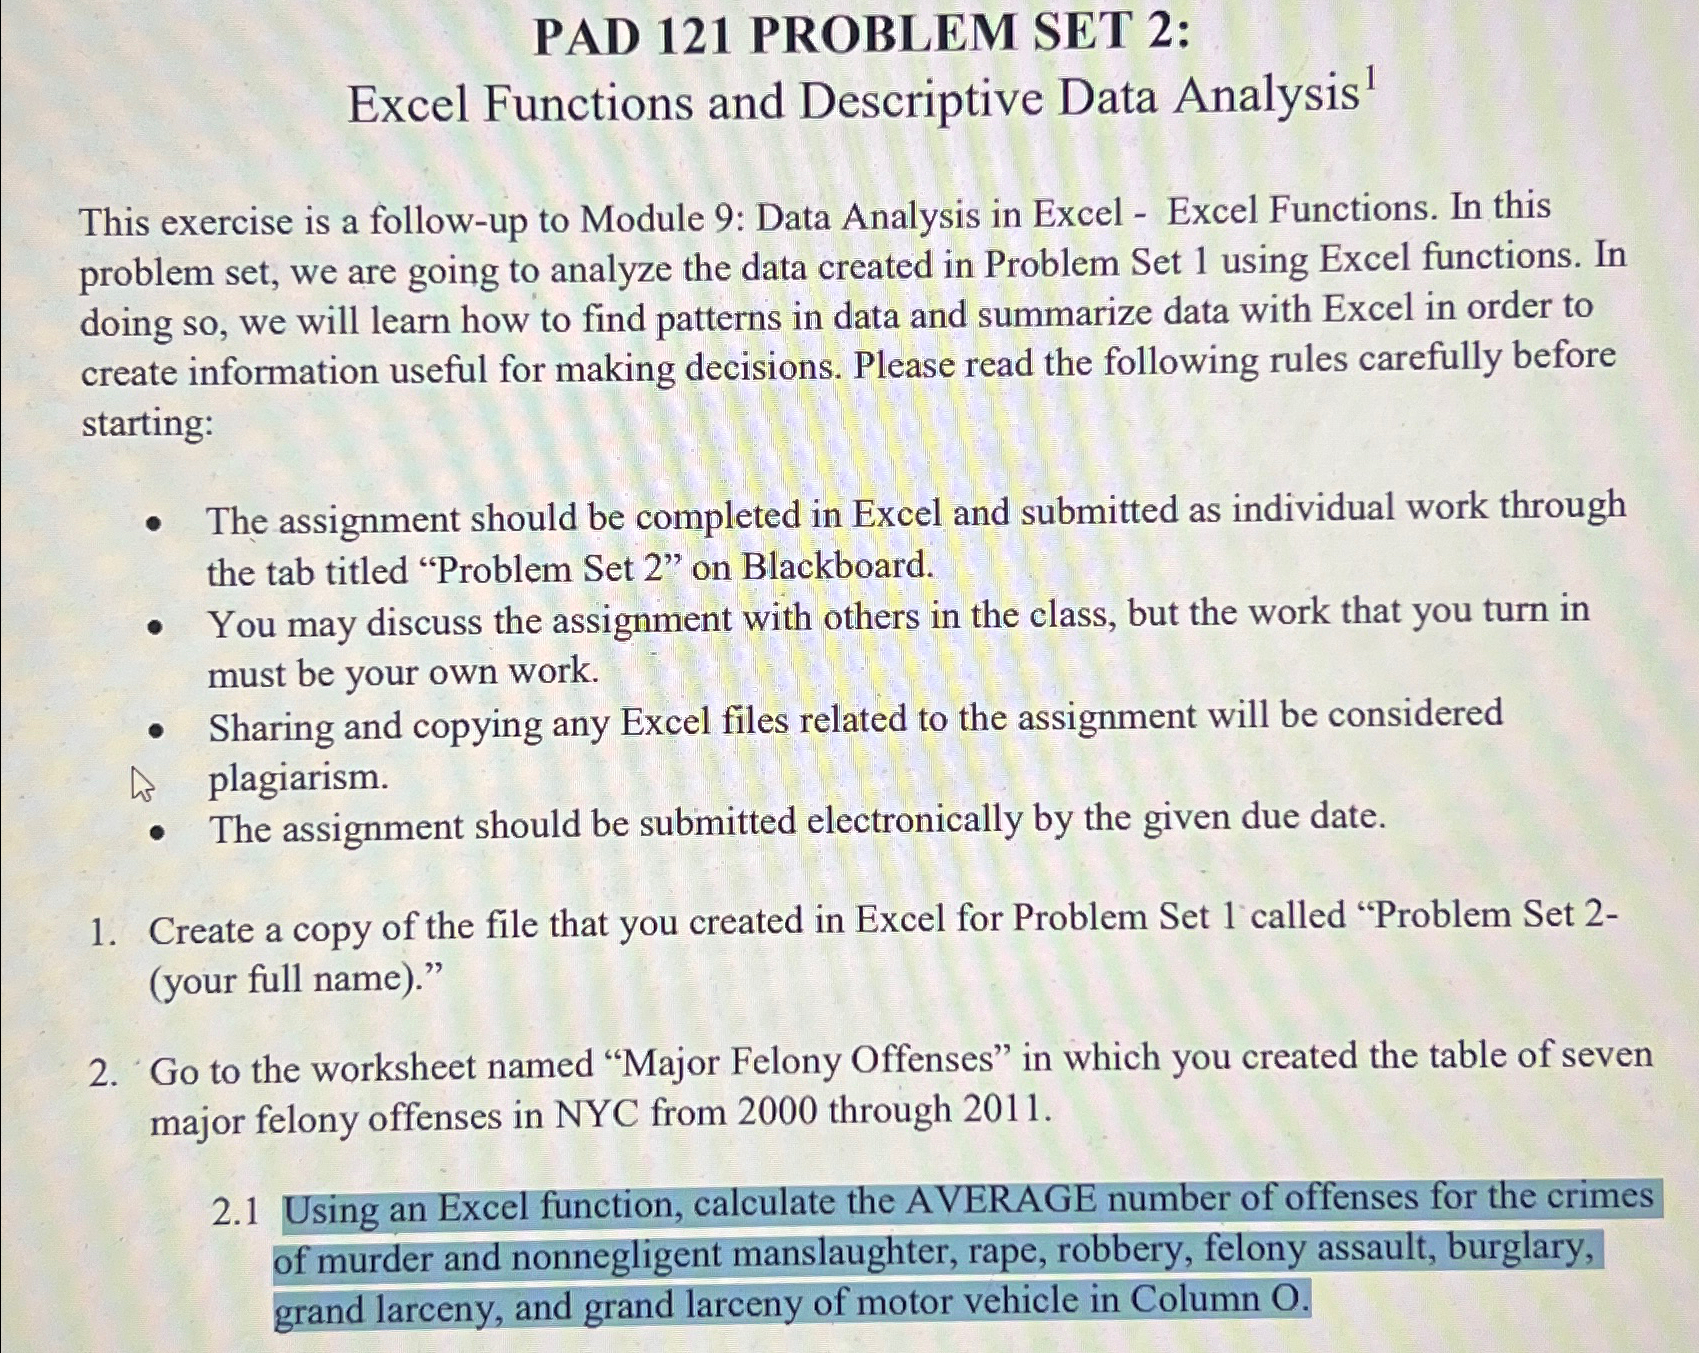
This exercise is a followup to Module : Data Analysis in Excel Excel Functions. In this problem set, we are going to analyze the data created in Problem Set using Excel functions. In doing so we will learn how to find patterns in data and summarize data with Excel in order to create information useful for making decisions. Please read the following rules carefully before starting:
The assignment should be completed in Excel and submitted as individual work through the tab titled "Problem Set on Blackboard.
You may discuss the assignment with others in the class, but the work that you turn in must be your own work.
Sharing and copying any Excel files related to the assignment will be considered
plagiarism.
The assignment should be submitted electronically by the given due date.
Create a copy of the file that you created in Excel for Problem Set called "Problem Set your full name
Go to the worksheet named "Major Felony Offenses" in which you created the table of seven major felony offenses in NYC from through
Using an Excel function, calculate the AVERAGE number of offenses for the crimes of murder and nonnegligent manslaughter, rape, robbery, felony assault, burglary, grand larceny, and grand larceny of motor vehicle in Column O
Step by Step Solution
There are 3 Steps involved in it
1 Expert Approved Answer
Step: 1 Unlock

Question Has Been Solved by an Expert!
Get step-by-step solutions from verified subject matter experts
Step: 2 Unlock
Step: 3 Unlock