

Question: Percent Obese by State Computer output giving descriptive statistics for the percent of the population that is obese for each of the 50 US
![(a) What are the mean and the standard deviation? [ mu= ]](https://dsd5zvtm8ll6.cloudfront.net/si.experts.images/questions/2022/09/63354c20b6522_1664437516668.png)
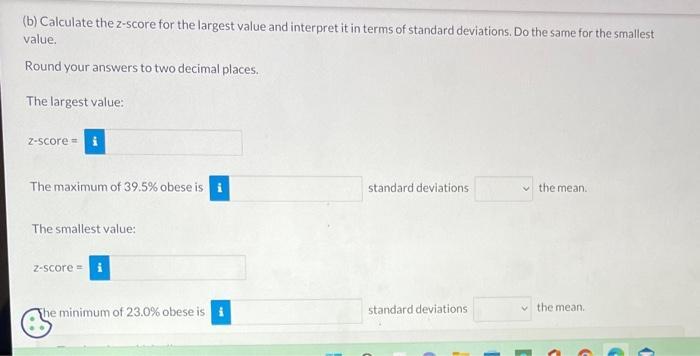
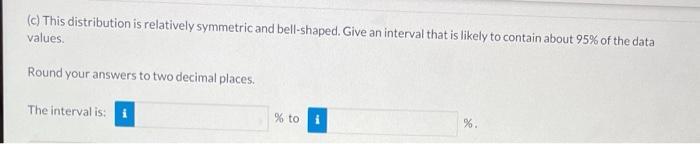
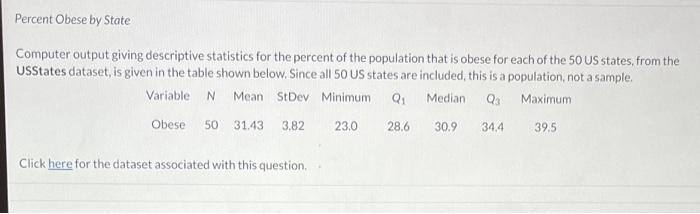
Percent Obese by State Computer output giving descriptive statistics for the percent of the population that is obese for each of the 50 US states, from the USStates dataset, is given in the table shown below. Since all 50 US states are included, this is a population, not a sample. Variable N Mean StDev Minimum Q Median Q3 Maximum 39.5 Obese 50 31.43 3.82 30.9 34.4 Click here for the dataset associated with this question. 23.0 28.6 (a) What are the mean and the standard deviation? = 0= APE i 31.43 i 3.82 de % % (b) Calculate the z-score for the largest value and interpret it in terms of standard deviations. Do the same for the smallest value. Round your answers to two decimal places. The largest value: Z-score= i The maximum of 39.5% obese is i The smallest value: z-score = i The minimum of 23.0% obese is i standard deviations standard deviations the mean.. the mean. (c) This distribution is relatively symmetric and bell-shaped. Give an interval that is likely to contain about 95% of the data values. Round your answers to two decimal places. The interval is: i % to %.
Step by Step Solution
There are 3 Steps involved in it
bal From the given data a b The 3143 1 3821 Largest ... View full answer

Get step-by-step solutions from verified subject matter experts