

Computer output giving descriptive statistics for the percent of the population that is obese for each of
Question:
Figure 2.27
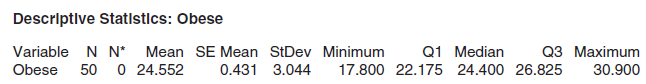
(a) What are the mean and the standard deviation? Include appropriate notation with your answers.
(b) Calculate the z-score for the largest value and interpret it in terms of standard deviations. Do the same for the smallest value.
(c) This distribution is relatively symmetric and bell-shaped. Give an interval that is likely to contain about 95% of the data values.
The word "distribution" has several meanings in the financial world, most of them pertaining to the payment of assets from a fund, account, or individual security to an investor or beneficiary. Retirement account distributions are among the most...
Fantastic news! We've Found the answer you've been seeking!
Step by Step Answer:
a We see in the computer output that the mean obesity rate is 24552 and the standard deviation is 30...View the full answer

Answered By
PALASH JHANWAR
I am a Chartered Accountant with AIR 45 in CA - IPCC. I am a Merit Holder ( B.Com ). The following is my educational details.
PLEASE ACCESS MY RESUME FROM THE FOLLOWING LINK: https://drive.google.com/file/d/1hYR1uch-ff6MRC_cDB07K6VqY9kQ3SFL/view?usp=sharing
3+ Reviews
10+ Question Solved
Related Book For 

Statistics Unlocking The Power Of Data
ISBN: 9780470601877
1st Edition
Authors: Robin H. Lock, Patti Frazer Lock, Kari Lock Morgan, Eric F. Lock, Dennis F. Lock
Question Posted:
