

Question: please answer 21-22 in excel with explanation. 21 Use the data below to calculate the control limits for an Xbar chart and R chart. (Manager's
please answer 21-22 in excel with explanation.
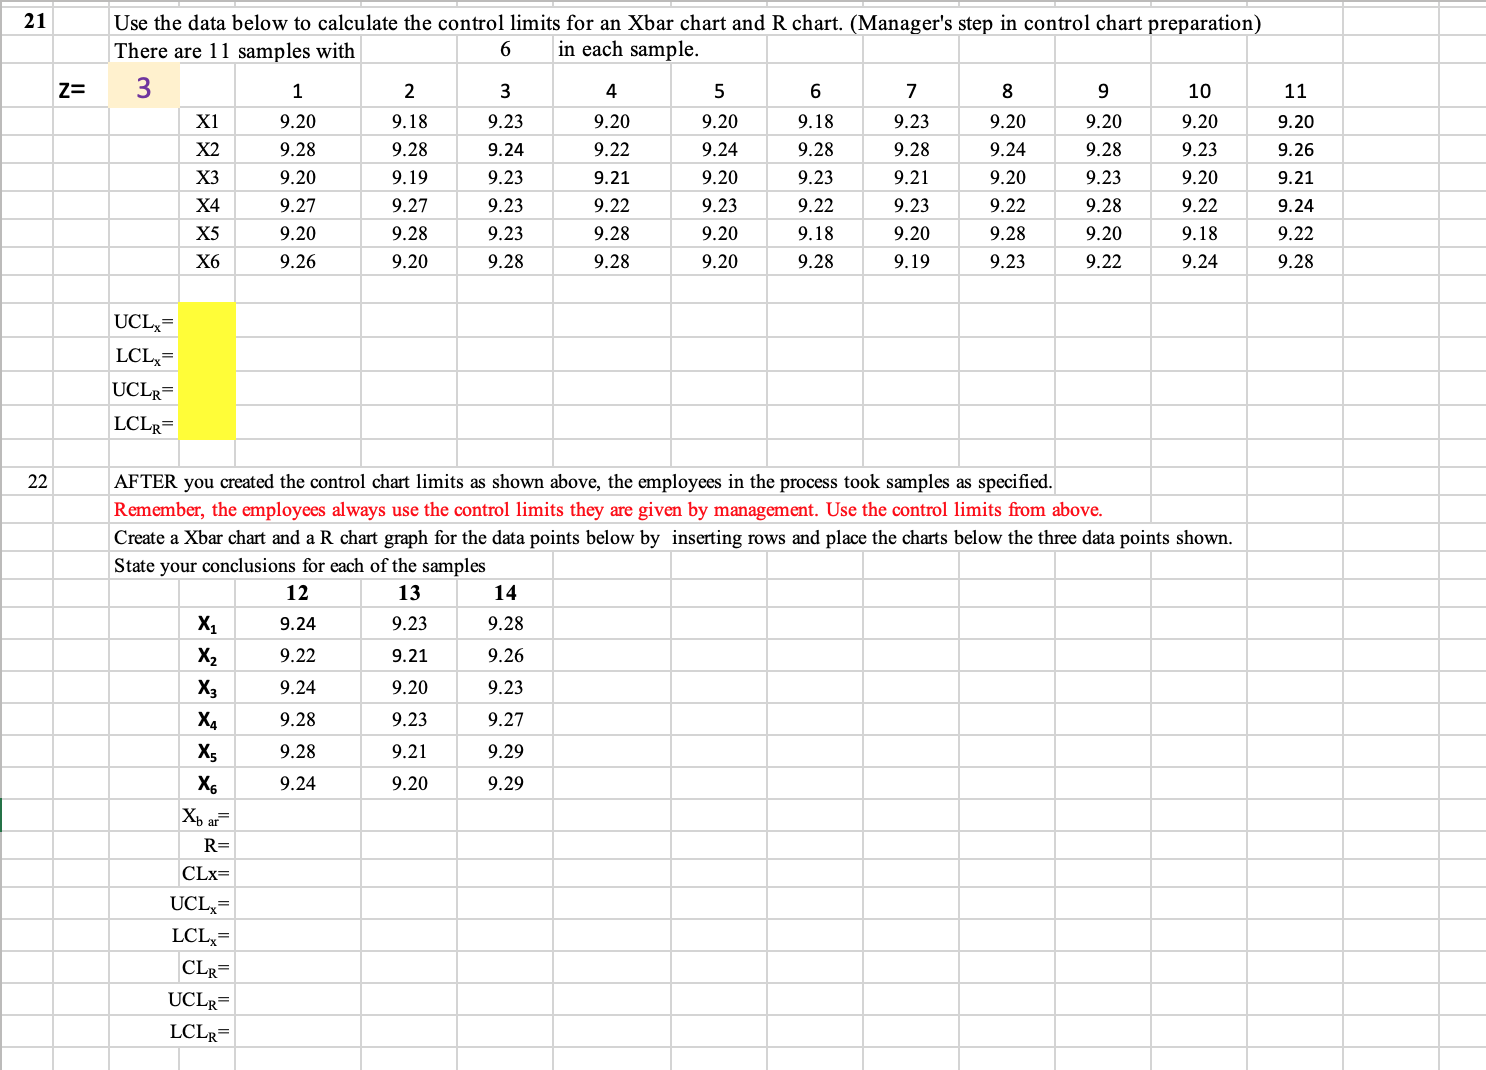
21 Use the data below to calculate the control limits for an Xbar chart and R chart. (Manager's step in control chart preparation) There are 11 samples with 6 in each sample. Z= 3 2 3 4 5 6 7 8 9 10 11 X1 9.20 9.18 9.23 9.20 9.20 9.18 9.23 9.20 9.20 9.20 9.20 X2 9.28 9.28 9.24 9.22 9.24 9.28 9.28 9.24 9.28 9.23 9.26 X3 9.20 9.19 9.23 9.21 9.20 9.23 9.2 9.20 9.23 9.20 9.21 X4 9.27 9.27 9.23 9.22 9.23 9.22 9.23 9.22 9.28 9.22 9.24 X5 9.20 .28 9.23 9.28 9.20 9.18 9.20 9.28 9.20 9.18 9.22 X6 9.26 9.20 9.28 9.28 9.20 9.28 9.19 9.23 9.22 9.24 9.28 UCL= LCL= UCLR LCLR 22 AFTER you created the control chart limits as shown above, the employees in the process took samples as specified. Remember, the employees always use the control limits they are given by management. Use the control limits from above. Create a Xbar chart and a R chart graph for the data points below by inserting rows and place the charts below the three data points shown. State your conclusions for each of the samples 12 13 14 X1 9.24 9.23 9.28 X 2 9.22 9.21 9.26 X3 9.24 9.20 9.23 Xa 9.28 9.23 9.27 X5 9.28 9.21 9.29 X6 9.24 9.20 9.29 Xbar R= CLX= UCL= LCLy= CLR UCLR= LCLR
Step by Step Solution
There are 3 Steps involved in it

Get step-by-step solutions from verified subject matter experts