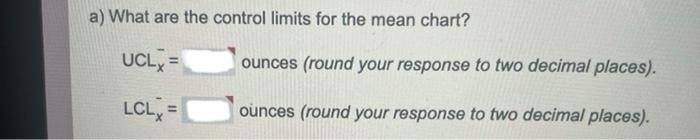
Question: please answer a and b !!!!! Refer to the table actors for Computing Control Chact Limits (3.sigma) for this problem Aprocess at Amt Eynan Botting

please answer a and b !!!!! please answer a and b !!!!! Refer to the table
please answer a and b !!!!! Refer to the table
Refer to the table actors for Computing Control Chact Limits (3.sigma) for this problem Aprocess at Amt Eynan Botting Company that is considered in control measures liquid in ounces. Below are the last 12 samples taken. The sample size 4. 6 10 19.9 1 202 20.1 19.8 19.9 2 19.9 19.9 19.7 20.1 3 19.8 19.9 20.0 20.1 4 20.1 19.9 19.9 198 5 198 20.1 20.1 19.9 197 19.6 19.7 194 7 202 20.1 19.9 19.9 8 20,1 20.1 19.8 19.7 9 20.0 19.9 20.1 19.8 19.8 11 20.1 20.1 19.8 19.9 12 19.9 19.4 197 198 201 199 a) What are the controllimits for the mean chart? UCL-ounces (round your response to two decimal places) a) What are the control limits for the mean chart? UCL = ounces (round your response to two decimal places). LCLX ounces (round your response to two decimal places). b) What are the control limits for the range chart? UCLR- ounces (round your response to two decimal places) LCLR- ounces (round your response to two decimal places)

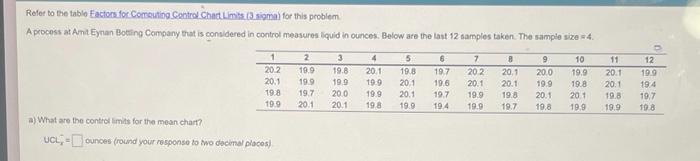
Step by Step Solution

There are 3 Steps involved in it

1 Expert Approved Answer
Step: 1 Unlock blur-text-image
Question Has Been Solved by an Expert!

Get step-by-step solutions from verified subject matter experts

Step: 2 Unlock
Step: 3 Unlock

Students Have Also Explored These Related General Management Questions!