

Question: PLEASE answer step by step (how you did it in excel, what you ran, etc. ) Phase A: Enterprise Industries (EI) produces Fresh, a brand
PLEASE answer step by step (how you did it in excel, what you ran, etc. )
Phase A:
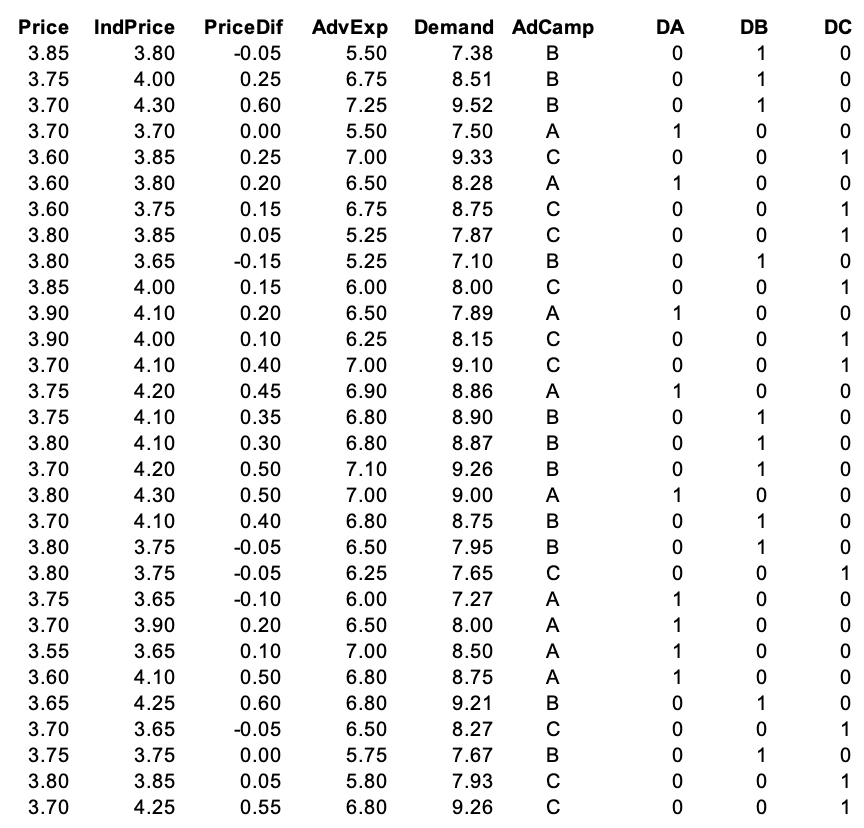
Enterprise Industries (EI) produces Fresh, a brand of liquid laundry detergent.In order to manage its inventory more effectively and make revenue projections, the company would like to better predict demand for Fresh.To develop a prediction model, the company has gathered data concerning demand for Fresh over the last 30 sales periods (each sales period is defined to be a four-week period).The data are in the Excel file Fresh.The variables are:
y: the demand for the large size bottle of Fresh (in hundreds of thousands of bottles in the period.
x1: the price (in dollars) of Fresh as offered by EI in the sales period.
x2: the average industry price (in dollars) of competitors' similar detergents in the sales period.
x3: Enterprise Industries advertising expenditure (in hundreds of thousands of dollars) to promote Fresh in the sales period.
Develop and evaluate the fit of a model of demand.What would be expected demand when the price for Fresh is $3.70, the average price of competitors' similar detergents is $3.90, and EIs' advertising expenditures is $6.50?
Phase B:
To ultimately increase the demand for Fresh, EIs' marketing department is comparing the effectiveness of three different advertising campaigns.The campaigns are denoted as A, B, and C.Campaign A consists entirely of television commercials, campaign B consists of a balanced mixture of TV and radio commercials, and campaign C consists of a balanced mixture of TV, radio, newspaper, and magazine ads.To conduct the study, EI randomly selected one advertising campaign to be used in each of the 30 sales periods.Although logic would indicate that each of campaigns A, B, and C should be used in 10 of the 30 sales periods, EI has made previous commitments to the advertising media in the study.As a result, campaigns A, B, and C were randomly assigned to, respectively, 9, 11, and 10 sales periods.Furthermore, advertising was done in only the first three weeks of each sales period, so that the carryover effect of the campaign used in a sales period to the next sales period would be minimized.
Compare the effectiveness of advertising campaigns A, B, and C.Use campaign A as the base campaign.Find, report, and interpret a model for demand when x1 is $3.70, x2 is $3.90, and x3 is $6.50.In addition, determine if there is a joint effect of x3 and either of the advertising campaigns.
Phase C:
To further the analysis, suppose EI believes on theoretical grounds that the difference between x1 and x2 adequately describes the effects of x1 and x2 on demand.That is, perhaps demands for Fresh depends more on how the price of Fresh compares to competitors' prices than it does on the absolute levels of the prices for Fresh and other competing detergents.This makes sense because most consumers must buy a certain amount of detergent no matter what the price might be.Consider the plots given with the data.The upper plot suggests a linear relationship between demand and price difference while the lower plot suggests a curvilinear relationship between demand and advertising expenditures.Add the appropriate terms to your best model obtained in Phase B.Evaluate the model and interpret your results.
\f
Step by Step Solution
There are 3 Steps involved in it

Get step-by-step solutions from verified subject matter experts