

Question: please can you answer it step-by-step? The Table below contains Data for the ages and diastolic- systolic blood pressures for group of patient boys. 1)
please can you answer it step-by-step?
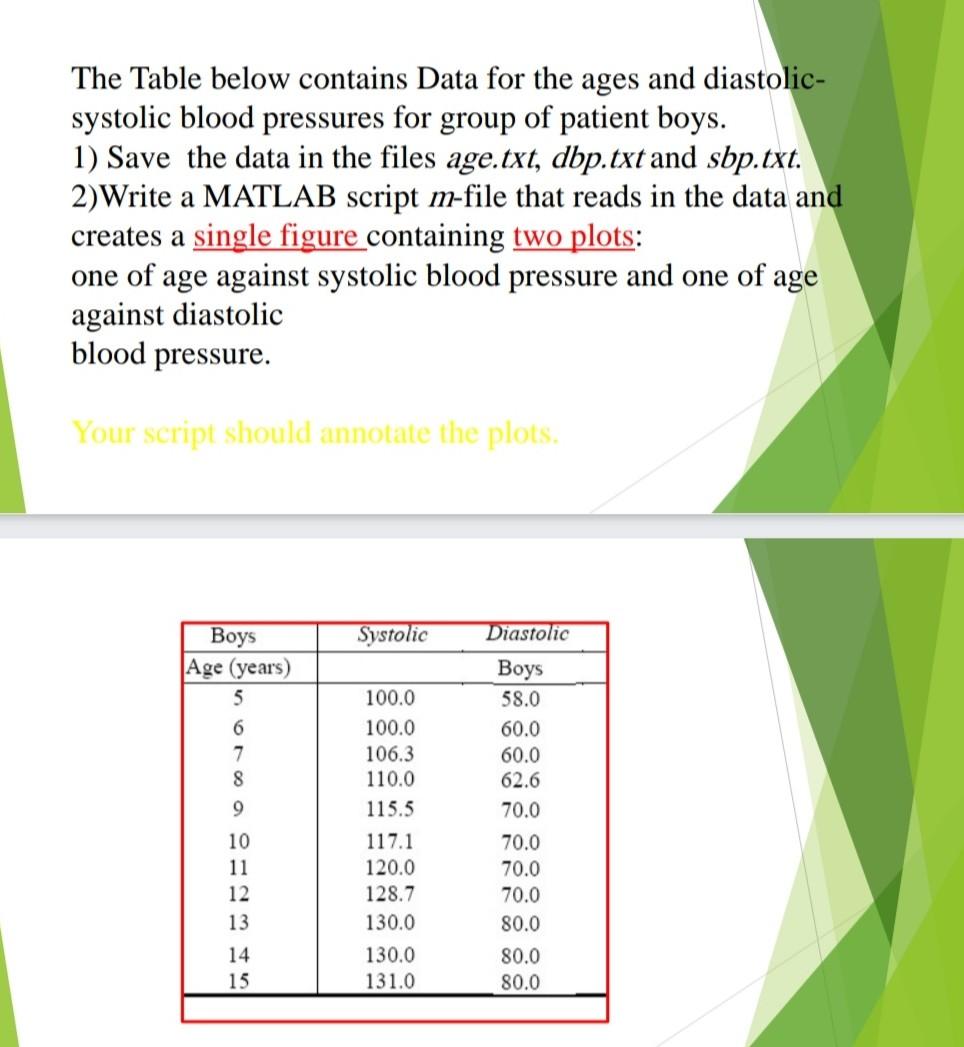
The Table below contains Data for the ages and diastolic- systolic blood pressures for group of patient boys. 1) Save the data in the files age.txt, dbp.txt and sbp.txt. 2)Write a MATLAB script m-file that reads in the data and creates a single figure containing two plots: one of age against systolic blood pressure and one of age against diastolic blood pressure. Your script should annotate the plots. Systolic Boys Age (years) 5 6 7 8 9 Diastolic Boys 58.0 60.0 60.0 62.6 70.0 70.0 70.0 70.0 80.0 80.0 80.0 100.0 100.0 106.3 110.0 115.5 117.1 120.0 128.7 130.0 130.0 131.0 10 11 12 13 14 15
Step by Step Solution
There are 3 Steps involved in it
1 Expert Approved Answer
Step: 1 Unlock

Question Has Been Solved by an Expert!
Get step-by-step solutions from verified subject matter experts
Step: 2 Unlock
Step: 3 Unlock