

Question: Please consider the chart below of Total Industry Capacity Utilization Index. This index captures the percentage of resources used by corporations and factories to produce
Please consider the chart below of Total Industry Capacity Utilization Index. This index captures the percentage of resources used by corporations and factories to produce goods in manufacturing, mining, and electric and gas utilities for all facilities located in the United States (excluding those in U.S. territories) in a given period. We can also think of capacity utilization as how much capacity is being used from the total available capacity to produce demanded finished products.
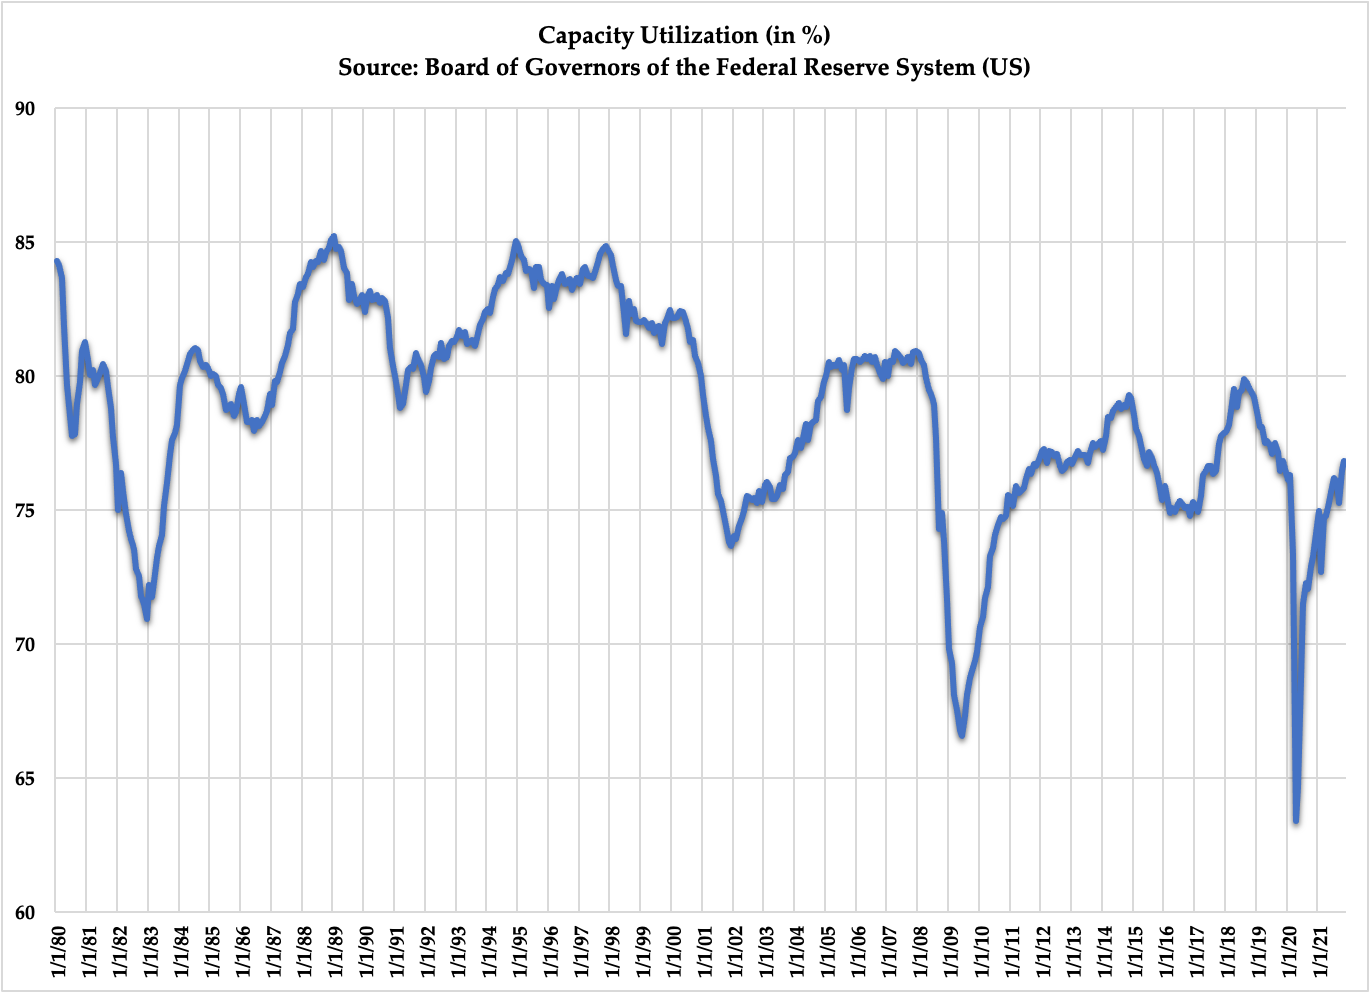
75 70 111180 111181 111182 111183 111184 111185 111186 111187 111188 Source: Board of Governors of the Federal Reserve System (US) 111189 111190 111191 111192 111193 111194 111195 Capacity Utilization (in %) 111196 111197 111198 111199 111100 111101 111102 111103 111104 111105 111106 111107 111108 111109 111110 111111 111113 111114 111116 111117 111118 111119 111120 111121
Step by Step Solution
There are 3 Steps involved in it

Get step-by-step solutions from verified subject matter experts