

Question: please explain the R code meaning for me, what is R code statistics meaning for each line Data list Data code Data betabasis betaestlist betafd
please explain the R code meaning for me, what is R code statistics meaning for each line
Data list
Data code
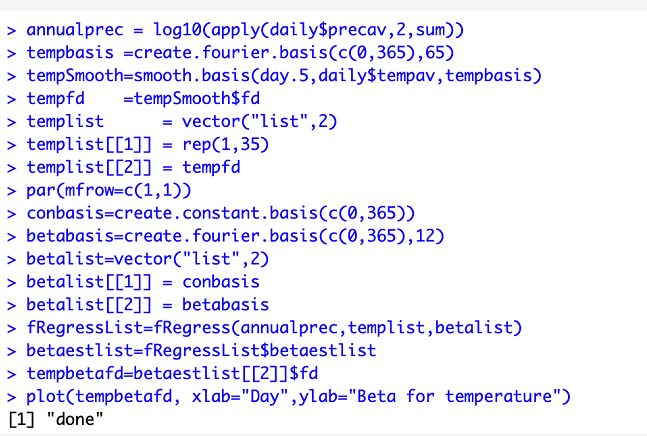
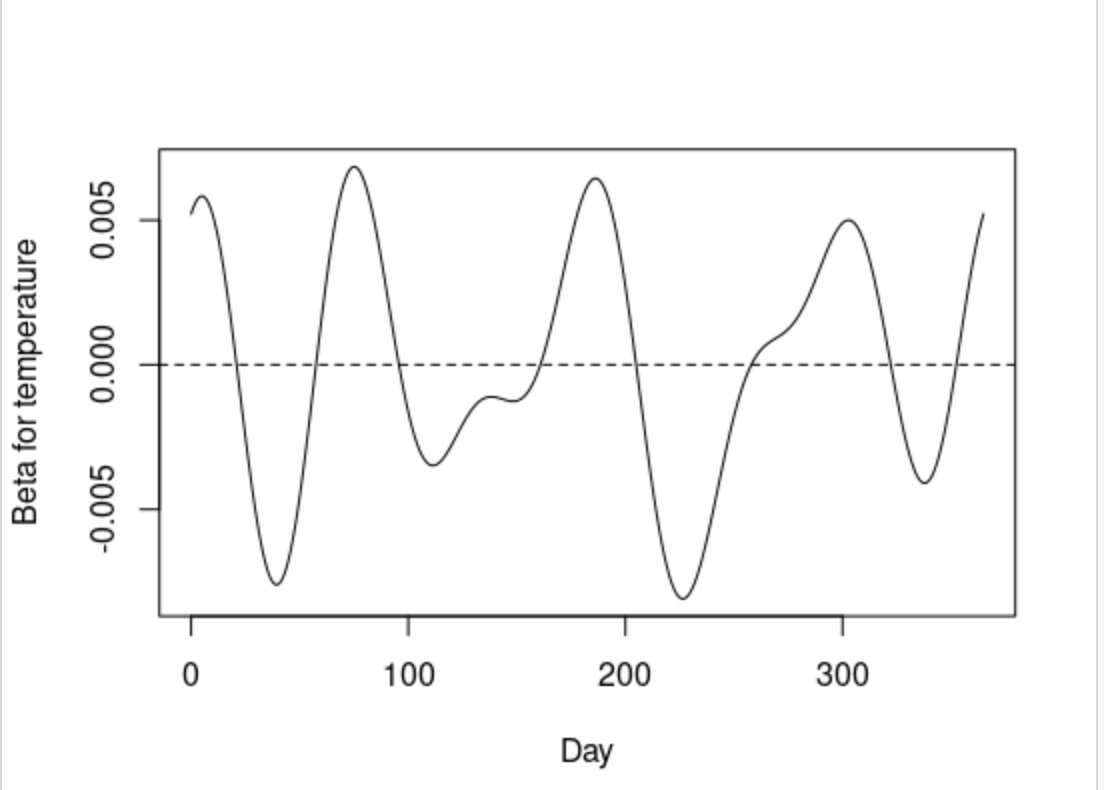
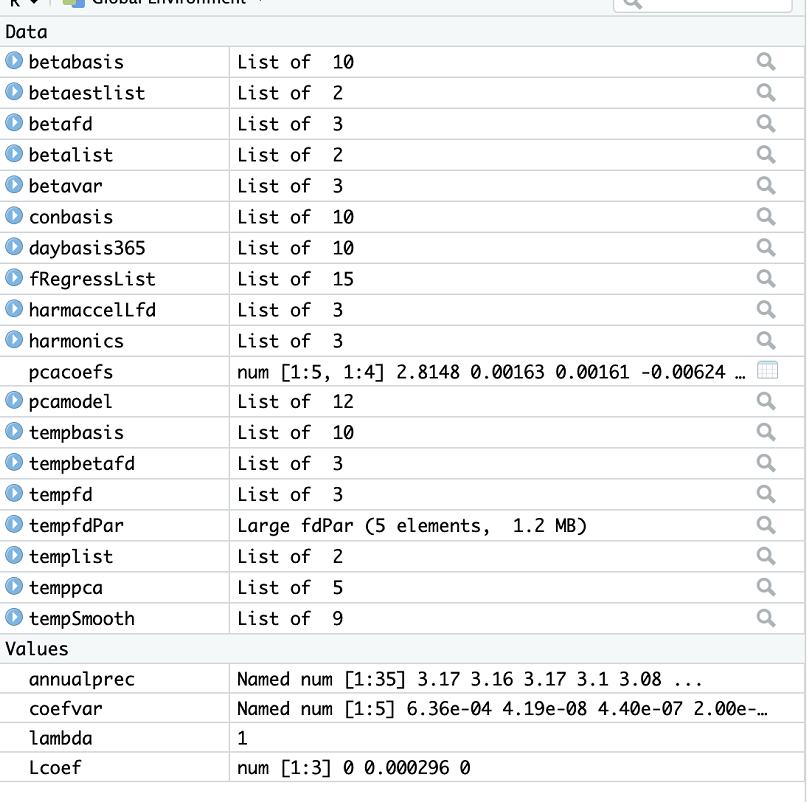
Data betabasis betaestlist betafd betalist betavar conbasis daybasis365 fRegressList harmaccellfd harmonics pcacoefs pcamodel tempbasis tempbetafd tempfd tempfdPar templist temppca temp Smooth Values annualprec coefvar lambda Lcoef List of 10 List of 2 List of 3 List of 2 List of 3 List of 10 List of 10 List of 15 List of 3 List of 3 num (1:5, 1:4] 2.8148 0.00163 0.00161 -0.00624 ... List of 12 List of 10 List of 3 List of 3 Large fdPar (5 elements, 1.2 MB) List of 2 List of 5 List of 9 0 0 0 0 0 0 0 0 0 0 0 0 0 0 0 0 0 0 Named num [1:35] 3.17 3.16 3.17 3.1 3.08 ... Named num [1:5] 6.36e-04 4.19e-08 4.40e-07 2.00e-... 1 num [1:3] 0 0.000296 0 > annualprec = log10(apply(daily$precav, 2, sum)) > tempbasis =create.fourier.basis(c(0,365), 65) > tempSmooth=smooth.basis(day.5, daily$tempav, tempbasis) > tempfd =tempSmooth$fd > templist = vector("list",2) > templist[[1]] = rep(1,35) > templist[[2]] = tempfd > par(mfrow=C(1,1)) > conbasis=create.constant.basis(c(0,365)) > betabasis=create.fourier.basis(CC0,365), 12) > betalist=vector("list",2) > betalist[[1]] = conbasis > betalist[[2]] = betabasis > fRegressList=fRegress(annualprec, templist, betalist) > betaestlist=fRegressList$betaestlist > tempbetafd=betaestlist[[2]]$fd > plot(tempbetafd, xlab="Day", ylab="Beta for temperature") [1] "done" Beta for temperature -0.005 0.000 0.005 100 Day 200 Mh A 300
Step by Step Solution
There are 3 Steps involved in it

Get step-by-step solutions from verified subject matter experts