

Question: PLEASE HELP answer q10-13 with explanation, Will Make Sure To Leave A Great Review. Thank You So Much. 10. An education researcher is interested in
PLEASE HELP answer q10-13 with explanation, Will Make Sure To Leave A Great Review. Thank You So Much.
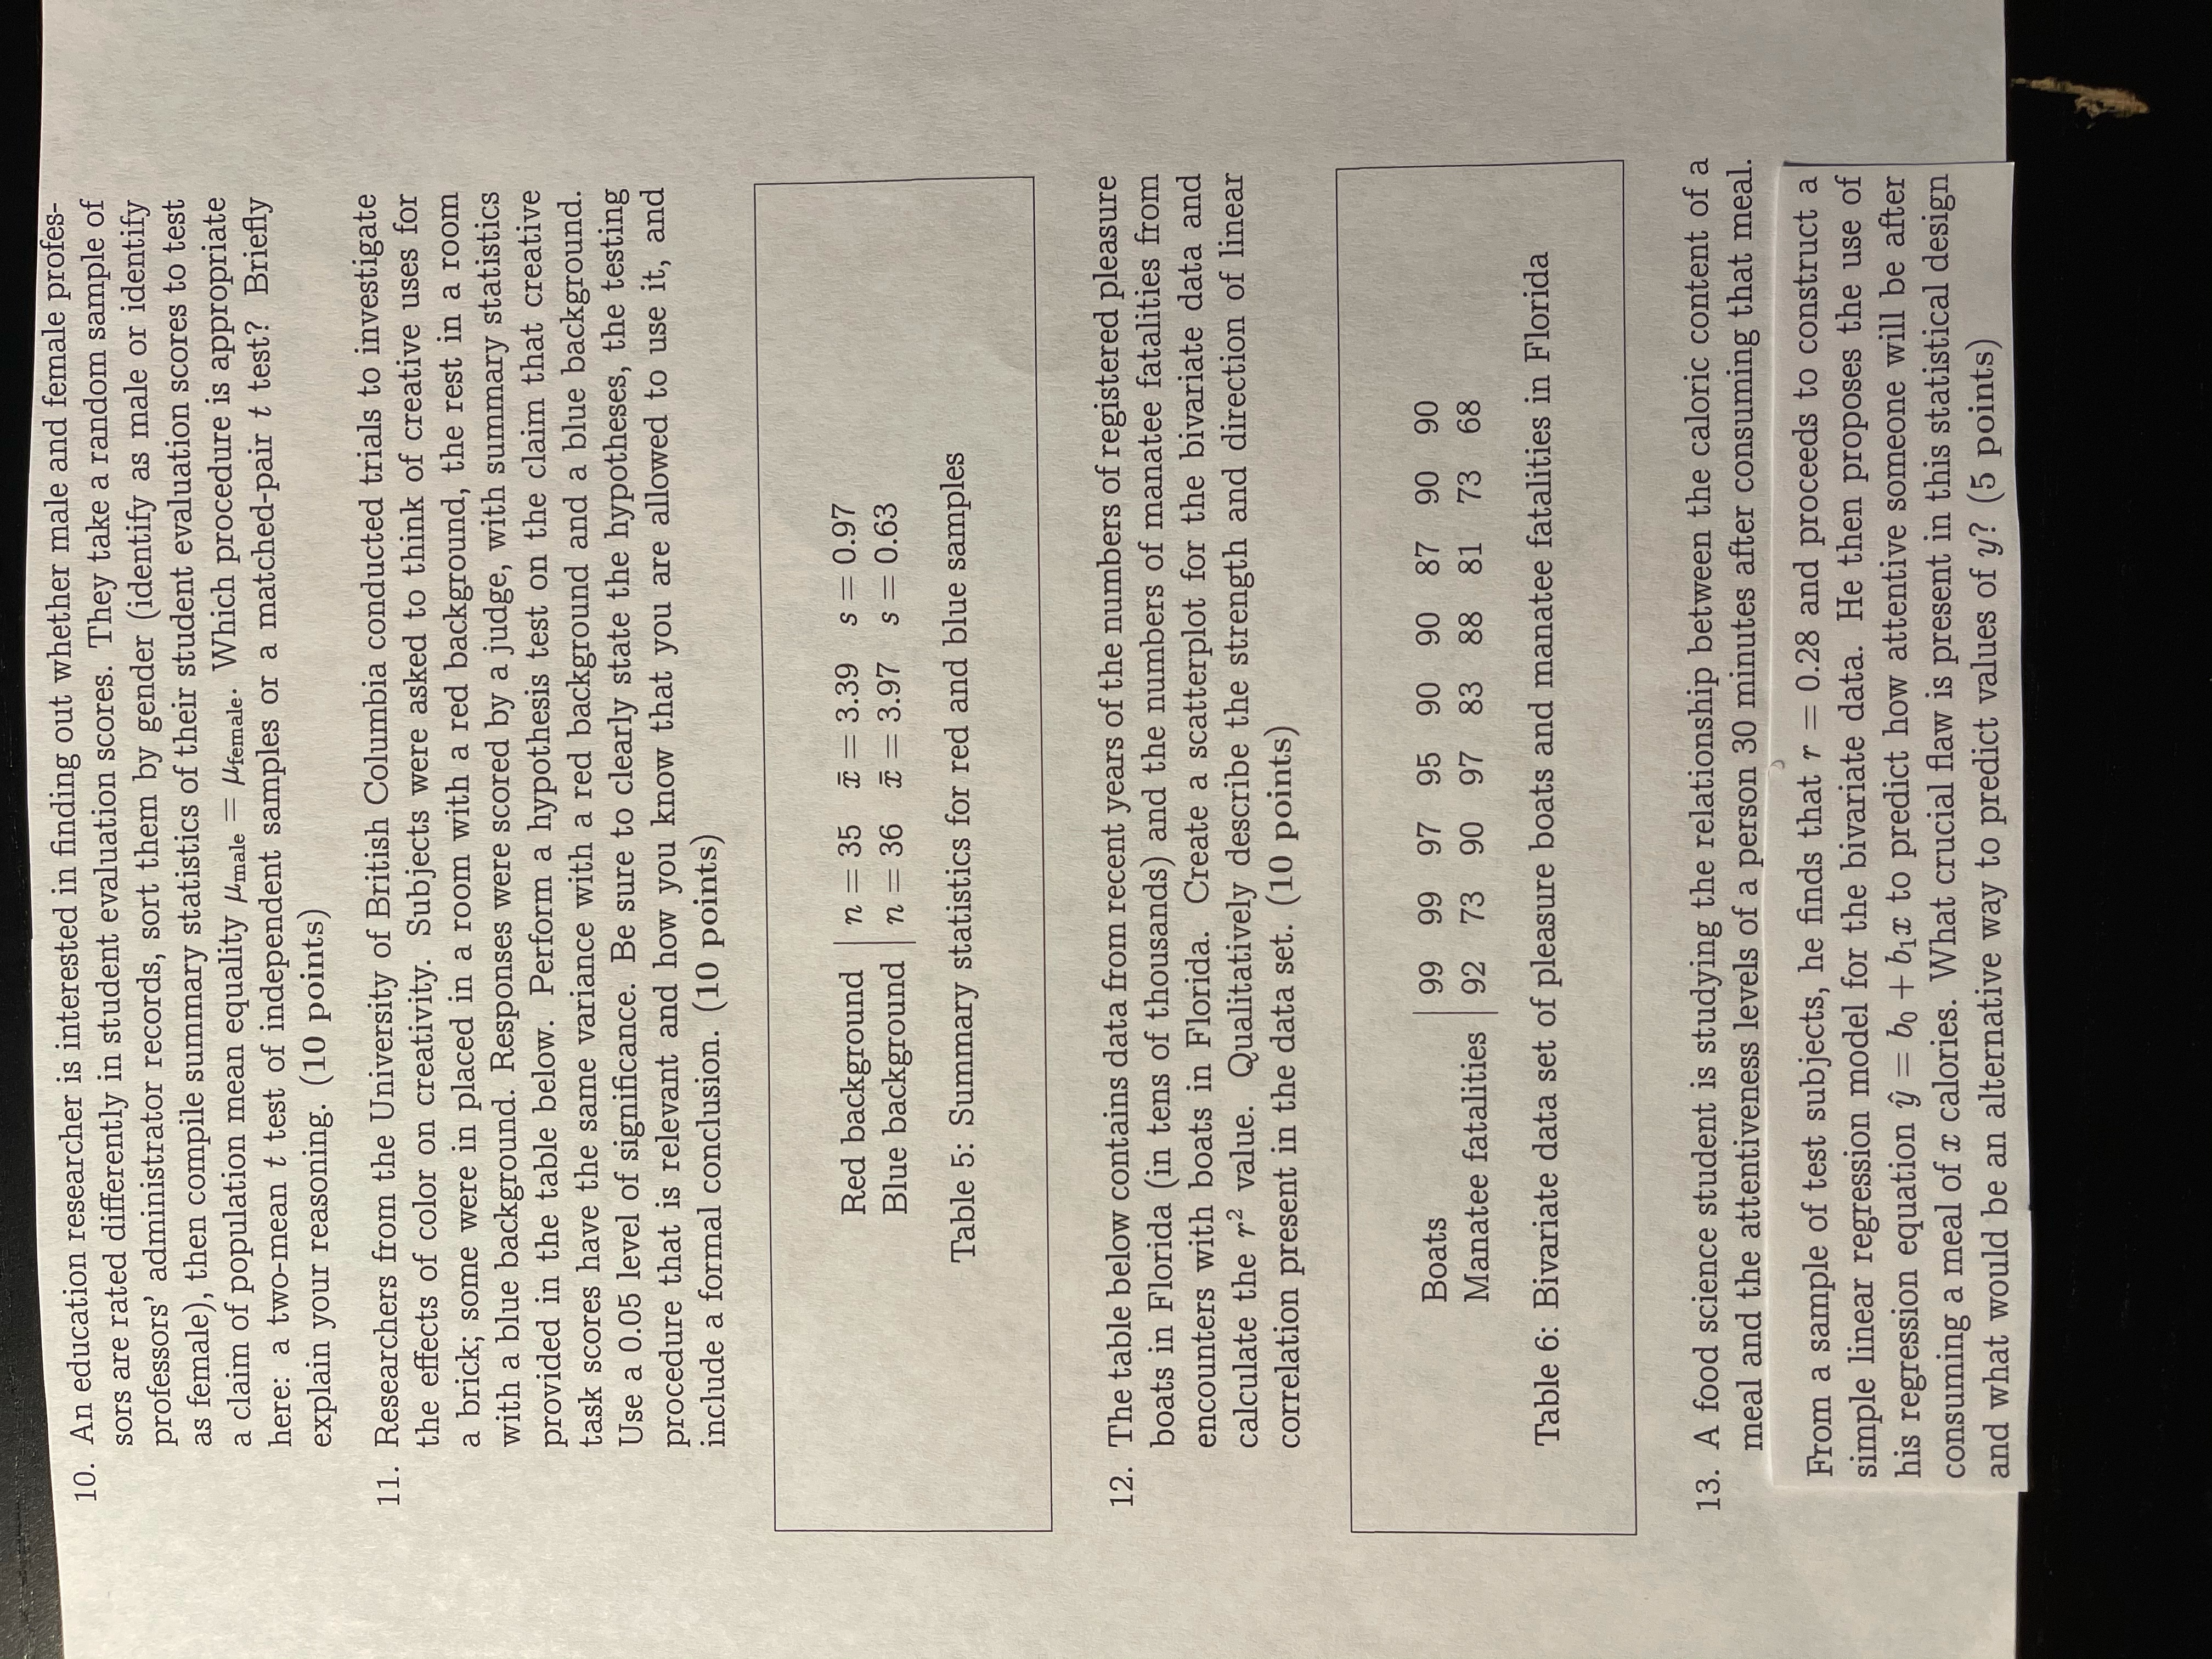
10. An education researcher is interested in finding out whether male and female profes- sors are rated differently in student evaluation scores. They take a random sample of professors' administrator records, sort them by gender (identify as male or identify as female), then compile summary statistics of their student evaluation scores to test a claim of population mean equality /male - Mfemale. Which procedure is appropriate here: a two-mean t test of independent samples or a matched-pair t test? Briefly explain your reasoning. (10 points) 11. Researchers from the University of British Columbia conducted trials to investigate the effects of color on creativity. Subjects were asked to think of creative uses for a brick; some were in placed in a room with a red background, the rest in a room with a blue background. Responses were scored by a judge, with summary statistics provided in the table below. Perform a hypothesis test on the claim that creative task scores have the same variance with a red background and a blue background. Use a 0.05 level of significance. Be sure to clearly state the hypotheses, the testing procedure that is relevant and how you know that you are allowed to use it, and include a formal conclusion. (10 points) Red background n = 35 - 3.39 s = 0.97 Blue background n = 36 I = 3.97 S = 0.63 Table 5: Summary statistics for red and blue samples 12. The table below contains data from recent years of the numbers of registered pleasure boats in Florida (in tens of thousands) and the numbers of manatee fatalities from encounters with boats in Florida. Create a scatterplot for the bivariate data and calculate the r2 value. Qualitatively describe the strength and direction of linear correlation present in the data set. (10 points) Boats 99 97 95 90 90 87 90 90 Manatee fatalities 92 73 90 97 83 88 81 73 6 Table 6: Bivariate data set of pleasure boats and manatee fatalities in Florida 13. A food science student is studying the relationship between the caloric content of a meal and the attentiveness levels of a person 30 minutes after consuming that meal. From a sample of test subjects, he finds that r = 0.28 and proceeds to construct a simple linear regression model for the bivariate data. He then proposes the use of his regression equation y = bo + bit to predict how attentive someone will be after consuming a meal of r calories. What crucial flaw is present in this statistical design and what would be an alternative way to predict values of y? (5 points)
Step by Step Solution
There are 3 Steps involved in it

Get step-by-step solutions from verified subject matter experts