

Question: Please help me to complete a BCG and GE/McKinsey Matrix with the above information. Thank you. December 25, 2011 EXHIBIT 7 BWW's Balance Sheets (Dollar
Please help me to complete a BCG and GE/McKinsey Matrix with the above information. Thank you.
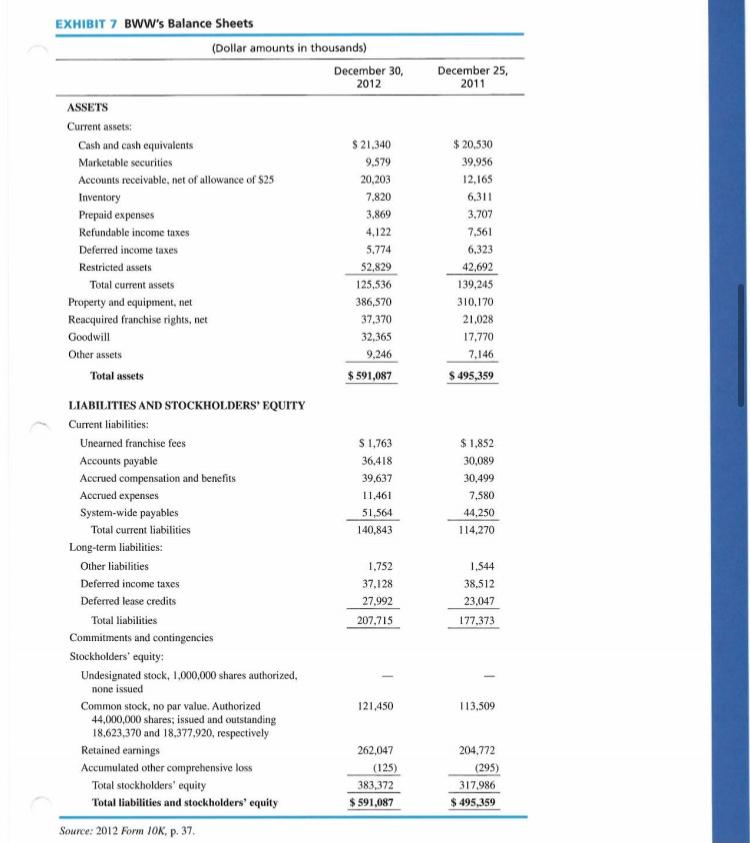
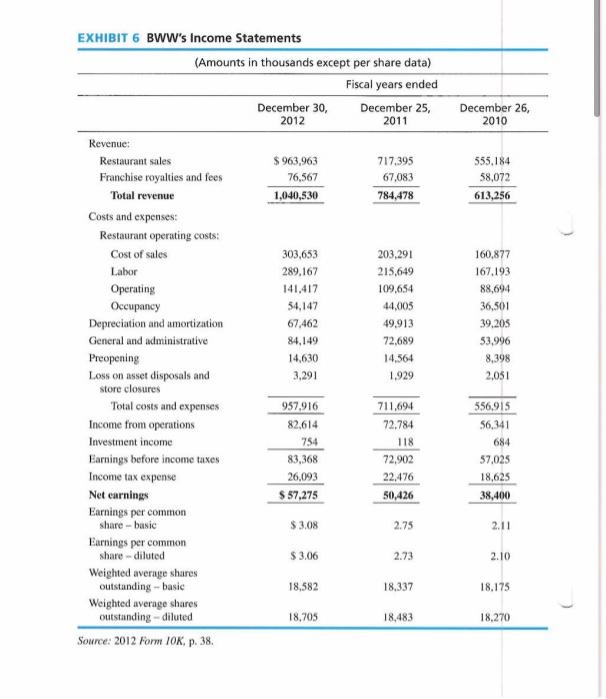
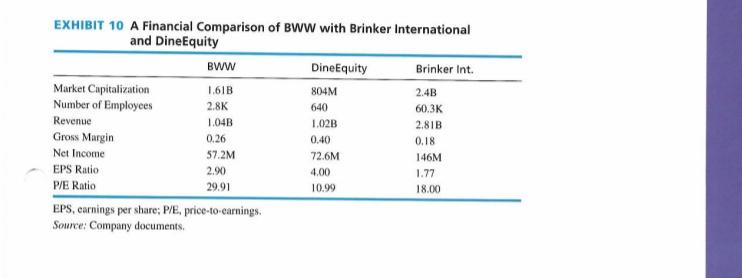
December 25, 2011 EXHIBIT 7 BWW's Balance Sheets (Dollar amounts in thousands) December 30, 2012 ASSETS Current assets: Cash and cash equivalents $ 21.340 Marketable securities 9.579 Accounts receivable, net of allowance of $25 20,203 Inventory 7,820 Prepaid expenses 3,869 Refundable income taxes 4,122 Deferred income taxes 5.774 Restricted assets 52.829 Total current assets 125,536 Property and equipment, net 386,570 Reacquired franchise rights, net 37,370 Goodwill 32,365 Other assets 9,246 Total assets $ 591,087 $ 20,530 39.956 12,165 6,311 3.707 7.561 6,323 42,692 139,245 310,170 21.028 17.770 7,146 $ 495,359 S 1.763 36,418 39,637 11,461 51,564 140,843 $ 1,852 30,089 30,499 7,580 44.250 114,270 LIABILITIES AND STOCKHOLDERS' EQUITY Current liabilities: Unearned franchise fees Accounts payable Accrued compensation and benefits Accrued expenses System-wide payables Total current liabilities Long-term liabilities: Other liabilities Deferred income taxes Deferred lease credits Total liabilities Commitments and contingencies Stockholders' equity: Undesignated stock, 1,000,000 shares authorized none issued Common stock, no par value. Authorized 44,000,000 shares; issued and outstanding 18.623.370 and 18,377,920, respectively Retained earnings Accumulated other comprehensive loss Total stockholders' equity Total liabilities and stockholders' equity Source: 2012 Form 10K, p. 37. 1.752 37.128 27,992 207,715 1.544 38,512 23,047 177,373 121,450 113,509 262,047 (125) 383,372 $ 591,087 204.772 (295) 317.986 $ 495,359 December 26, 2010 76,567 555.184 58,072 613,256 EXHIBIT 6 BWW's Income Statements (Amounts in thousands except per share data) Fiscal years ended December 30, December 25, 2012 2011 Revenue: Restaurant sales $ 963,963 717,395 Franchise royalties and fees 67,083 Total revenue 1,040,530 784,478 Costs and expenses Restaurant operating costs: Cost of sales 303,653 203,291 Labor 289,167 215,649 Operating 141,417 109.654 Occupancy 54,147 44,005 Depreciation and amortization 67,462 49.913 General and administrative 84,149 72,689 Preopening 14,630 14,564 Loss on asset disposals and 3.291 1.929 store closures Total costs and expenses 957.916 711,694 Income from operations 82,614 72.784 Investment income 754 118 Earnings before income taxes 83,368 72,902 Income tax expense 26,093 22.476 Net earnings $ 57,275 50,426 Earnings per common share -- basic $ 3.08 Earnings per common share - diluted $ 3.06 2.73 Weighted average shares outstanding-basie 18,582 18.337 Weighted average shares outstanding - diluted 18.705 18,483 Source: 2012 Form IOK, p. 38. 160.877 167,193 88,694 36,501 39,205 53,996 8,398 2,051 556,915 56,341 684 57,025 18,625 38,400 2.75 2.11 2.10 18.175 18.270 EXHIBIT 10 A Financial Comparison of BWW with Brinker International and DineEquity BWW DineEquity Brinker Int. Market Capitalization 1.61B 804M 2.4B Number of Employees 2.8K 640 60.3K Revenue 1.04B 2.81B Gross Margin 0.26 0.40 0.18 Net Income 57.2M 72.6M 146M EPS Ratio 2.90 4.00 1.77 P/E Ratio 29.91 10.99 18.00 EPS, earnings per share; PE, price-to-carnings Source: Company documents, 1.02BStep by Step Solution
There are 3 Steps involved in it
1 Expert Approved Answer
Step: 1 Unlock

Question Has Been Solved by an Expert!
Get step-by-step solutions from verified subject matter experts
Step: 2 Unlock
Step: 3 Unlock