

Question: Please include excel formulas Use the Excel OM Aggregate Planning spreadsheet and the data to prepare your aggregate plan. Produce a graph of your plan.
Please include excel formulas
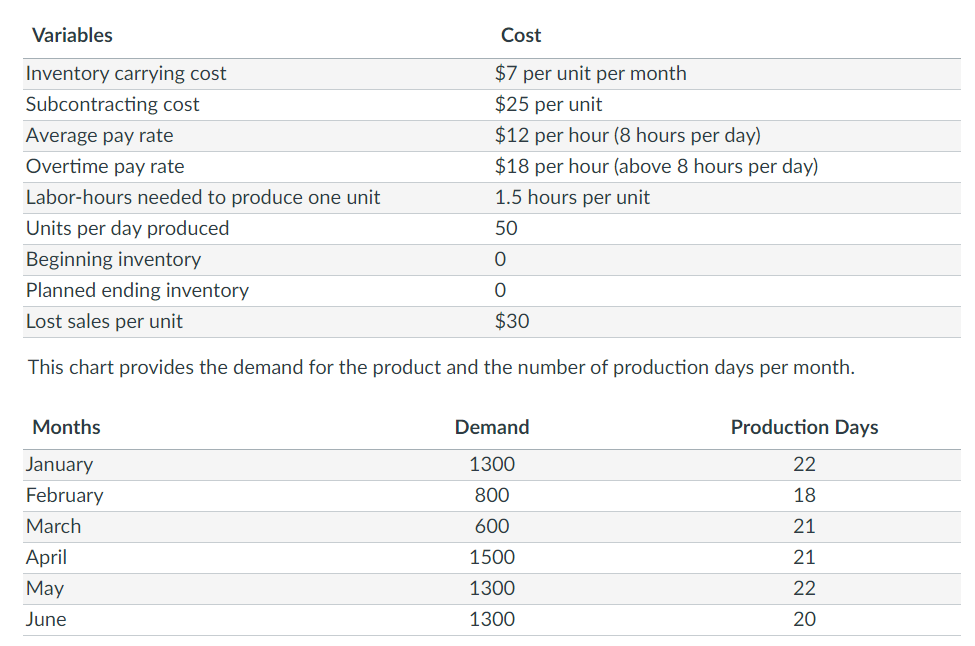
Use the Excel OM Aggregate Planning spreadsheet and the data to prepare your aggregate plan. Produce a graph of your plan. The intent is to use a level strategy (or level scheduling) with no overtime, no safety stock, and no subcontractors.
Hint 1 - Consider that it takes 1.5 hours to produce a unit when determining your cost per unit for average and overtime pay.
Hint 2 - To determine regular time production, you need to multiply the units per day produced by the number of production days.
Step by Step Solution
There are 3 Steps involved in it
1 Expert Approved Answer
Step: 1 Unlock

Question Has Been Solved by an Expert!
Get step-by-step solutions from verified subject matter experts
Step: 2 Unlock
Step: 3 Unlock