

Question: Please read and follow the below instructions and provide answer to each section and step; Use the data table to provide statistical analysis Provide formula
Please read and follow the below instructions and provide answer to each section and step;
- Use the data table to provide statistical analysis
- Provide formula calculation for each county and step
- Provide a narrative for each step explaining the process
- Provide a Graphical Chart of the Frequency Polygon
- Provide a report to discuss the result
- Hypotheses:Sacramento County has a higher number of homeless individuals per capita than other counties in California.
Use the following statistical calculation method;
- Calculate the per capita homeless number for each county
- Get the mean and standard deviation of the per capita.
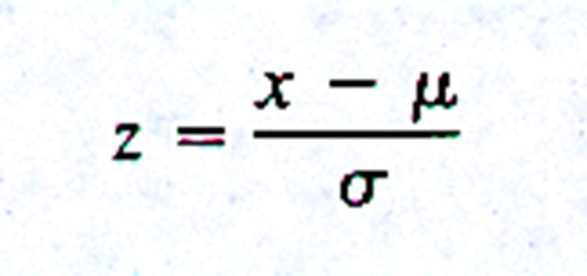
- Then Calculatethe per capita Z score.
Frequency Distribution:
- Create Graphical Chart: Frequency Polygon Normal Probability Distribution
- Z score: number of standard deviations a score of interest falls from the mean of the normal distribution.
- X per capita for Sacramento.
- U average of all other counties Divided by the standard deviation of counties.
\f
Step by Step Solution
There are 3 Steps involved in it
1 Expert Approved Answer
Step: 1 Unlock

Question Has Been Solved by an Expert!
Get step-by-step solutions from verified subject matter experts
Step: 2 Unlock
Step: 3 Unlock